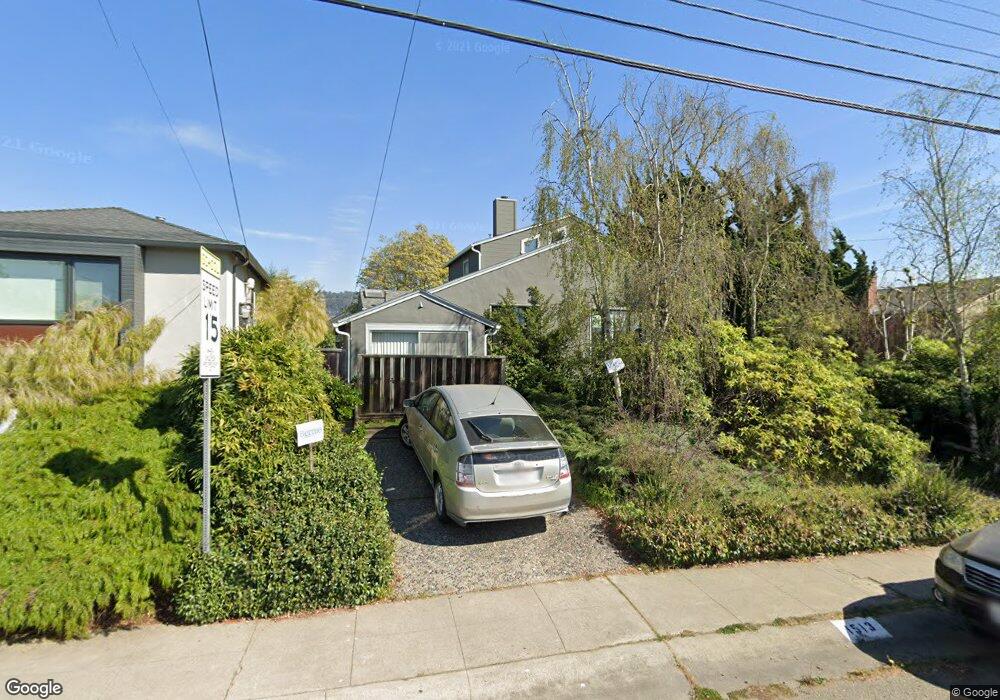
1513 Acton St Berkeley, CA 94702
West Berkeley NeighborhoodEstimated Value: $1,401,000 - $1,803,000
3
Beds
2
Baths
1,519
Sq Ft
$1,023/Sq Ft
Est. Value
About This Home
This home is located at 1513 Acton St, Berkeley, CA 94702 and is currently estimated at $1,554,383, approximately $1,023 per square foot. 1513 Acton St is a home located in Alameda County with nearby schools including Ruth Acty Elementary, Berkeley Arts Magnet at Whittier School, and Thousand Oaks Elementary School.
Ownership History
Date
Name
Owned For
Owner Type
Purchase Details
Closed on
Mar 19, 2015
Sold by
Epstein Epstein Howard S Howard S and Epstein Howard S
Bought by
Epstein Howard S and The Howard S Epstein Living Tr
Current Estimated Value
Purchase Details
Closed on
Dec 7, 2005
Sold by
Epstein Howard S and Epstein Beryl L
Bought by
Epstein Howard S and Epstein Beryl L
Create a Home Valuation Report for This Property
The Home Valuation Report is an in-depth analysis detailing your home's value as well as a comparison with similar homes in the area
Home Values in the Area
Average Home Value in this Area
Purchase History
| Date | Buyer | Sale Price | Title Company |
|---|---|---|---|
| Epstein Howard S | -- | None Available | |
| Epstein Howard S | -- | -- |
Source: Public Records
Tax History
| Year | Tax Paid | Tax Assessment Tax Assessment Total Assessment is a certain percentage of the fair market value that is determined by local assessors to be the total taxable value of land and additions on the property. | Land | Improvement |
|---|---|---|---|---|
| 2025 | $6,908 | $273,354 | $103,590 | $176,764 |
| 2024 | $6,908 | $267,857 | $101,559 | $173,298 |
| 2023 | $6,684 | $269,468 | $99,568 | $169,900 |
| 2022 | $6,453 | $257,185 | $97,616 | $166,569 |
| 2021 | $6,433 | $252,006 | $95,702 | $163,304 |
| 2020 | $5,999 | $256,350 | $94,721 | $161,629 |
| 2019 | $5,655 | $251,325 | $92,864 | $158,461 |
| 2018 | $5,519 | $246,397 | $91,043 | $155,354 |
| 2017 | $5,301 | $241,566 | $89,258 | $152,308 |
| 2016 | $5,041 | $236,830 | $87,508 | $149,322 |
| 2015 | $4,952 | $233,274 | $86,194 | $147,080 |
| 2014 | $4,874 | $228,706 | $84,506 | $144,200 |
Source: Public Records
Map
Nearby Homes
- 1368 Rose St
- 1322 Virginia St
- 1631 Belvedere Ave
- 1626 Hopkins St
- 1728 Curtis St
- 1120 Curtis St
- 1127 Key Route Blvd
- 1339 Kains Ave
- 1716 Hearst Ave
- 1841 Vine St
- 1919 Curtis St
- 1425 Martin Luther King jr Way
- 1625 Martin Luther King jr Way
- 1036 Ramona Ave
- 1114 Talbot Ave
- 1504 10th St
- 1498 Sonoma Ave
- 1609 Bonita Ave Unit 5
- 2118 California St
- 1610 Milvia St
Your Personal Tour Guide
Ask me questions while you tour the home.