Estimated Value: $201,000 - $270,000
--
Bed
1
Bath
1,615
Sq Ft
$148/Sq Ft
Est. Value
About This Home
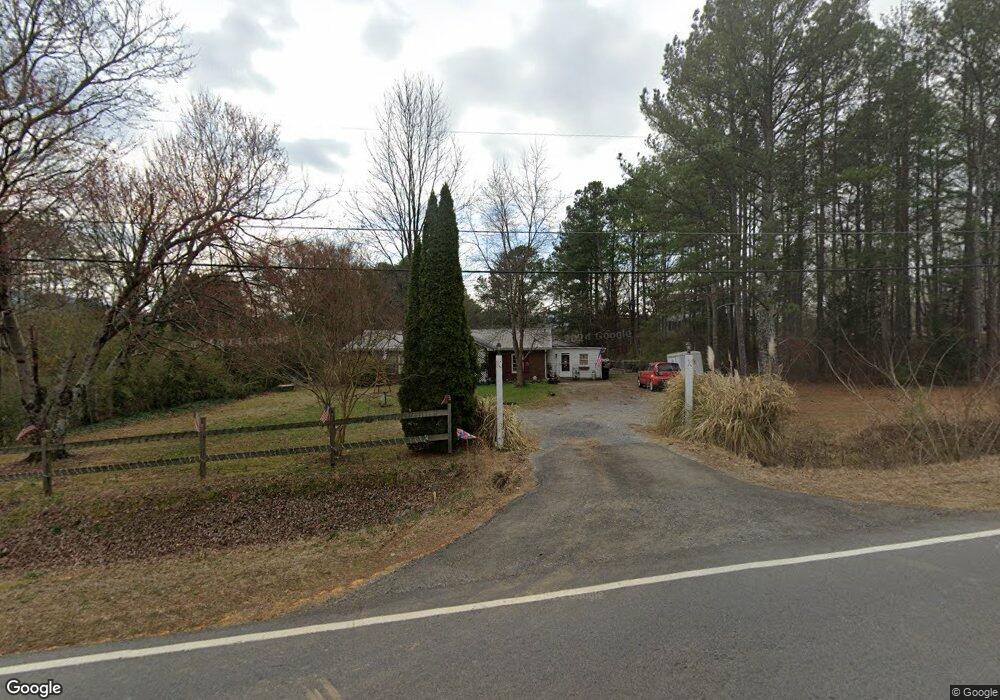
This home is located at 1513 Burnett Ferry Rd SW, Rome, GA 30165 and is currently estimated at $238,781, approximately $147 per square foot. 1513 Burnett Ferry Rd SW is a home located in Floyd County with nearby schools including Coosa Middle School and Coosa High School.
Ownership History
Date
Name
Owned For
Owner Type
Purchase Details
Closed on
Aug 27, 2014
Current Estimated Value
Purchase Details
Closed on
Oct 3, 2007
Sold by
Not Provided
Purchase Details
Closed on
Oct 1, 2007
Sold by
Not Provided
Purchase Details
Closed on
May 18, 2001
Purchase Details
Closed on
Apr 7, 1994
Sold by
Secretary Of Veterans Affairs
Purchase Details
Closed on
Jul 6, 1993
Sold by
Williams Betty L
Bought by
Secretary Of Veterans Affairs
Purchase Details
Closed on
Apr 4, 1980
Sold by
Adminstrator Of Veterans Affairs
Bought by
Williams Betty L
Purchase Details
Closed on
Jun 6, 1979
Sold by
Pennamco Inc
Bought by
Adminstrator Of Veterans Affairs
Purchase Details
Closed on
Jun 5, 1979
Sold by
Ellis William Thomas
Bought by
Pennamco Inc
Purchase Details
Closed on
Sep 9, 1977
Bought by
Ellis William Thomas
Create a Home Valuation Report for This Property
The Home Valuation Report is an in-depth analysis detailing your home's value as well as a comparison with similar homes in the area
Home Values in the Area
Average Home Value in this Area
Purchase History
| Date | Buyer | Sale Price | Title Company |
|---|---|---|---|
| -- | -- | -- | |
| -- | -- | -- | |
| -- | -- | -- | |
| -- | -- | -- | |
| -- | $52,100 | -- | |
| Secretary Of Veterans Affairs | $30,000 | -- | |
| Williams Betty L | $29,900 | -- | |
| Adminstrator Of Veterans Affairs | $24,200 | -- | |
| Pennamco Inc | -- | -- | |
| Ellis William Thomas | $25,000 | -- |
Source: Public Records
Tax History Compared to Growth
Tax History
| Year | Tax Paid | Tax Assessment Tax Assessment Total Assessment is a certain percentage of the fair market value that is determined by local assessors to be the total taxable value of land and additions on the property. | Land | Improvement |
|---|---|---|---|---|
| 2024 | $910 | $77,288 | $9,315 | $67,973 |
| 2023 | $880 | $74,904 | $8,468 | $66,436 |
| 2022 | $525 | $53,606 | $6,920 | $46,686 |
| 2021 | $301 | $40,806 | $6,310 | $34,496 |
| 2020 | $962 | $38,718 | $5,487 | $33,231 |
| 2019 | $928 | $37,391 | $5,487 | $31,904 |
| 2018 | $899 | $35,742 | $5,226 | $30,516 |
| 2017 | $882 | $34,662 | $4,838 | $29,824 |
| 2016 | $885 | $34,288 | $4,800 | $29,488 |
| 2015 | -- | $34,688 | $4,800 | $29,888 |
| 2014 | -- | $31,707 | $4,800 | $26,907 |
Source: Public Records
Map
Nearby Homes
- 876 Barker Rd SW
- 3 SW Highlander Trail SW
- 14 Bryan Springs Rd SW
- 0 Roberts Rd SW Unit 10525813
- 0 Roberts Rd SW Unit 7582010
- 1 Willowrun Dr SW
- 0 Mt Alto Rd Sw Lot Unit WP001
- 37 Willowrun Dr SW
- The Foxcroft Plan at North Haven
- The Benson II Plan at North Haven
- The Coleman Plan at North Haven
- The Bradley Plan at North Haven
- The McGinnis Plan at North Haven
- The Pearson Plan at North Haven
- The Caldwell Plan at North Haven
- The Grayson Plan at North Haven
- 26 Berryrun Dr SW
- 248 Smith Rd SW
- 23 Bush Arbor Place SW
- 10 Bush Arbor Place SW
- 1505 Burnett Ferry Rd SW
- 1527 Burnett Ferry Rd SW
- 1513 Radio Springs Rd SW
- 1493 Burnett Ferry Rd SW
- 1521 Radio Springs Rd SW
- 1496 Burnett Ferry Rd SW
- 1496 Burnett Ferry Rd SW
- 1543 Burnett Ferry Rd SW
- 1500 Radio Springs Rd SW
- 1475 Radio Springs Rd SW
- 1467 Radio Springs Rd SW
- 1480 Radio Springs Rd SW
- 1457 Radio Springs Rd SW
- 1585 Burnett Ferry Rd SW
- 1466 Radio Springs Rd SW
- 1566 Burnett Ferry Rd SW
- 1460 Burnett Ferry Rd SW
- 1460 Burnett Ferry Rd SW
- 1445 Radio Springs Rd SW
- 1449 Burnett Ferry Rd SW