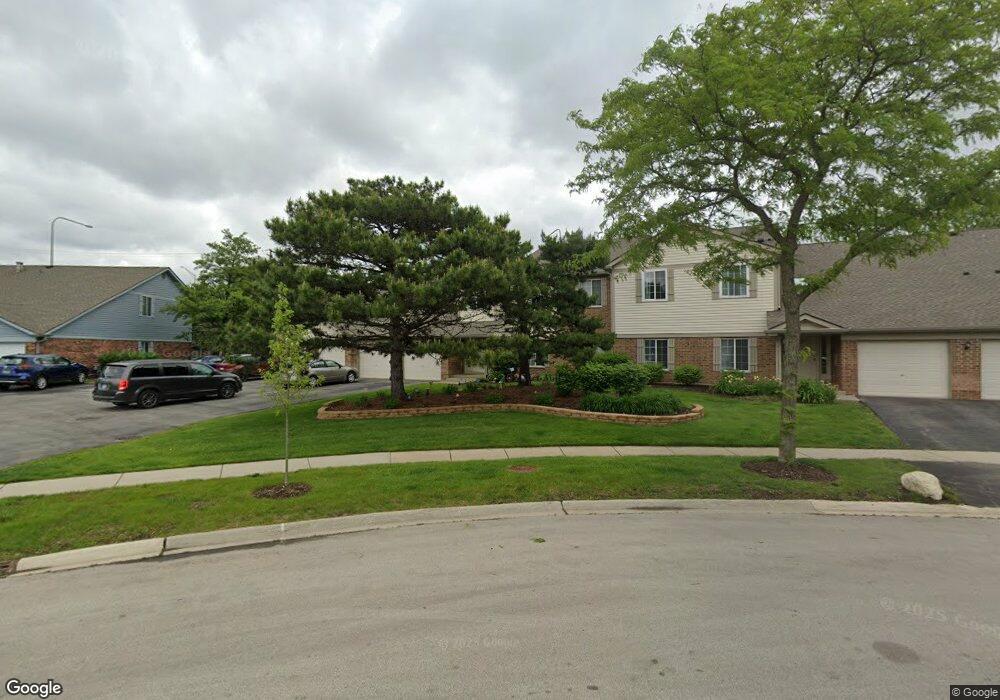
1513 Commodore Ct Unit 70261 Schaumburg, IL 60193
South Schaumburg NeighborhoodEstimated Value: $284,000 - $296,000
2
Beds
--
Bath
1,200
Sq Ft
$242/Sq Ft
Est. Value
About This Home
This home is located at 1513 Commodore Ct Unit 70261, Schaumburg, IL 60193 and is currently estimated at $290,575, approximately $242 per square foot. 1513 Commodore Ct Unit 70261 is a home located in Cook County with nearby schools including Hanover Highlands Elementary School, Robert Frost Junior High School, and Schaumburg High School.
Ownership History
Date
Name
Owned For
Owner Type
Purchase Details
Closed on
Apr 14, 2021
Sold by
Campbell Clarice A
Bought by
Davenport Amy S
Current Estimated Value
Home Financials for this Owner
Home Financials are based on the most recent Mortgage that was taken out on this home.
Original Mortgage
$154,400
Outstanding Balance
$143,423
Interest Rate
5%
Mortgage Type
New Conventional
Estimated Equity
$147,152
Purchase Details
Closed on
Aug 29, 1996
Sold by
Stafford Mary Anne
Bought by
Campbell Clarice A
Home Financials for this Owner
Home Financials are based on the most recent Mortgage that was taken out on this home.
Original Mortgage
$97,200
Interest Rate
8.27%
Purchase Details
Closed on
Jun 9, 1995
Sold by
Snelson Horven V and Snelson Margaret A
Bought by
Snelson Margaret A and Stafford Mary Anne
Create a Home Valuation Report for This Property
The Home Valuation Report is an in-depth analysis detailing your home's value as well as a comparison with similar homes in the area
Home Values in the Area
Average Home Value in this Area
Purchase History
| Date | Buyer | Sale Price | Title Company |
|---|---|---|---|
| Davenport Amy S | $193,000 | Old Republic Title | |
| Campbell Clarice A | $108,000 | -- | |
| Snelson Margaret A | -- | -- |
Source: Public Records
Mortgage History
| Date | Status | Borrower | Loan Amount |
|---|---|---|---|
| Open | Davenport Amy S | $154,400 | |
| Previous Owner | Campbell Clarice A | $97,200 |
Source: Public Records
Tax History Compared to Growth
Tax History
| Year | Tax Paid | Tax Assessment Tax Assessment Total Assessment is a certain percentage of the fair market value that is determined by local assessors to be the total taxable value of land and additions on the property. | Land | Improvement |
|---|---|---|---|---|
| 2024 | $4,294 | $18,645 | $2,409 | $16,236 |
| 2023 | $4,135 | $18,645 | $2,409 | $16,236 |
| 2022 | $4,135 | $18,645 | $2,409 | $16,236 |
| 2021 | $2,572 | $14,482 | $1,575 | $12,907 |
| 2020 | $2,650 | $14,482 | $1,575 | $12,907 |
| 2019 | $4,346 | $16,215 | $1,575 | $14,640 |
| 2018 | $3,325 | $11,079 | $1,297 | $9,782 |
| 2017 | $1,478 | $11,079 | $1,297 | $9,782 |
| 2016 | $3,060 | $11,079 | $1,297 | $9,782 |
| 2015 | $1,172 | $9,830 | $1,204 | $8,626 |
| 2014 | $1,135 | $9,830 | $1,204 | $8,626 |
| 2013 | $993 | $9,830 | $1,204 | $8,626 |
Source: Public Records
Map
Nearby Homes
- 1662 Commodore Ct Unit 70294
- 1467 Fairlane Dr Unit 1B
- 1471 Fairlane Dr Unit 2A
- 1518 Harbour Ct Unit A1
- 1721 Chesapeake Ln Unit 4
- 1460 Fairlane Dr Unit 228
- 1463 Mercury Dr Unit 115
- 1463 Mercury Dr Unit 304
- 1410 Brownstone Place Unit 38
- 6908 Orchard Ln
- 1882 Keystone Place Unit 1882
- 1102 Westover Ln Unit 1C
- 7031 Glenwood Ln
- 6915 Hawthorne Ln
- 7468 Filmore Ave
- 738 Crest Ave
- 1011 Mercury Dr Unit 7
- 6938 Meadowbrook Ln
- 664 Wedgewood Dr
- 1000 Webster Ln
- 1513 Commodore Ct Unit 4
- 1513 Commodore Ct Unit 70264
- 1513 Commodore Ct Unit 70263
- 1513 Commodore Ct Unit 70262
- 1513 Commodore Ct Unit 3
- 1513 Commodore Ct Unit 1
- 1517 Commodore Ct Unit 5
- 1517 Commodore Ct Unit 70267
- 1517 Commodore Ct Unit 70265
- 1517 Commodore Ct Unit 70266
- 1517 Commodore Ct Unit 70268
- 1517 Commodore Ct Unit 6
- 1517 Commodore Ct Unit 8
- 1517 Commodore Ct Unit 7
- 1509 Commodore Ct Unit 70277
- 1509 Commodore Ct Unit 70276
- 1509 Commodore Ct Unit 70275
- 1509 Commodore Ct Unit 70278
- 1509 Commodore Ct Unit 7
- 1509 Commodore Ct Unit 5