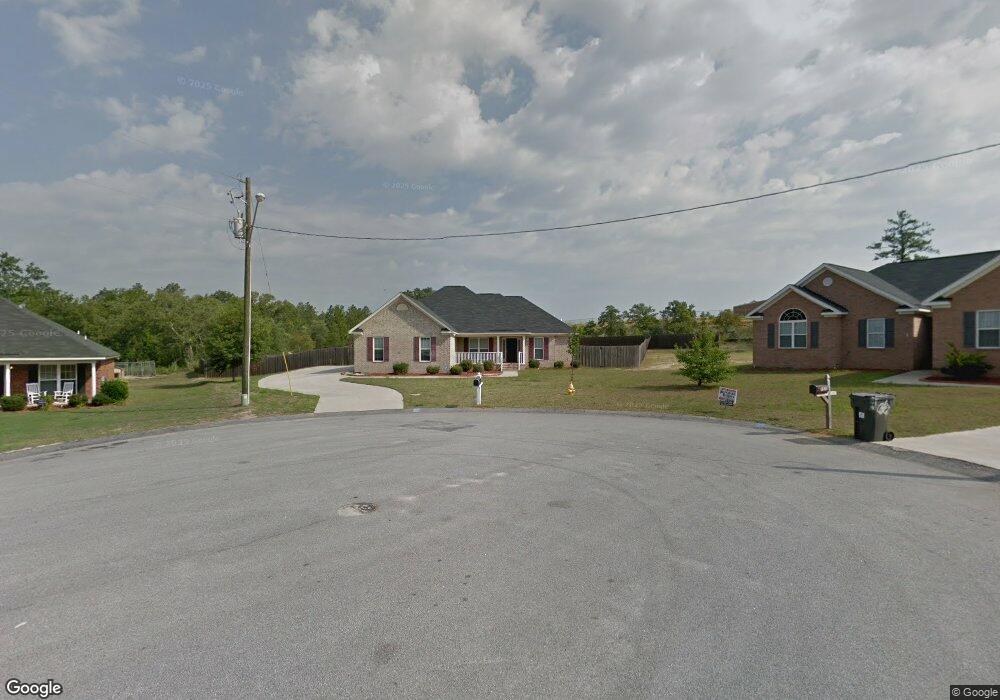
1513 Jonathan Place Hephzibah, GA 30815
Jamestown NeighborhoodEstimated Value: $270,000 - $326,000
3
Beds
3
Baths
2,288
Sq Ft
$129/Sq Ft
Est. Value
About This Home
This home is located at 1513 Jonathan Place, Hephzibah, GA 30815 and is currently estimated at $294,019, approximately $128 per square foot. 1513 Jonathan Place is a home located in Richmond County with nearby schools including R.B. Hunt Elementary School, Deer Chase Elementary School, and Hephzibah Middle School.
Ownership History
Date
Name
Owned For
Owner Type
Purchase Details
Closed on
Nov 12, 2015
Sold by
Falu Jafet Caleb
Bought by
Falu Angela Marie and Reyna Henry
Current Estimated Value
Purchase Details
Closed on
Nov 2, 2007
Sold by
Joe Hall Home Improvements Inc
Bought by
Falu Angela Marie and Falu Jafet Caleb
Home Financials for this Owner
Home Financials are based on the most recent Mortgage that was taken out on this home.
Original Mortgage
$176,617
Interest Rate
6.37%
Mortgage Type
VA
Create a Home Valuation Report for This Property
The Home Valuation Report is an in-depth analysis detailing your home's value as well as a comparison with similar homes in the area
Home Values in the Area
Average Home Value in this Area
Purchase History
| Date | Buyer | Sale Price | Title Company |
|---|---|---|---|
| Falu Angela Marie | -- | -- | |
| Falu Angela Marie | $172,900 | None Available |
Source: Public Records
Mortgage History
| Date | Status | Borrower | Loan Amount |
|---|---|---|---|
| Previous Owner | Falu Angela Marie | $176,617 |
Source: Public Records
Tax History Compared to Growth
Tax History
| Year | Tax Paid | Tax Assessment Tax Assessment Total Assessment is a certain percentage of the fair market value that is determined by local assessors to be the total taxable value of land and additions on the property. | Land | Improvement |
|---|---|---|---|---|
| 2025 | $3,547 | $114,500 | $12,400 | $102,100 |
| 2024 | $3,547 | $105,108 | $12,400 | $92,708 |
| 2023 | $3,213 | $103,676 | $12,400 | $91,276 |
| 2022 | $3,066 | $95,344 | $12,400 | $82,944 |
| 2021 | $2,543 | $69,856 | $12,400 | $57,456 |
| 2020 | $2,502 | $69,856 | $12,400 | $57,456 |
| 2019 | $2,656 | $69,856 | $12,400 | $57,456 |
| 2018 | $2,358 | $60,166 | $12,400 | $47,766 |
| 2017 | $2,292 | $60,166 | $12,400 | $47,766 |
| 2016 | $2,294 | $60,166 | $12,400 | $47,766 |
| 2015 | $2,310 | $60,166 | $12,400 | $47,766 |
| 2014 | $2,303 | $59,862 | $12,400 | $47,462 |
Source: Public Records
Map
Nearby Homes
- 1708 Ethan Way
- 1764 Deer Chase Ln
- 1432 Issac Way
- 1610 Jonathan Place
- 2160 Kaneck Way
- 1855 Beaver Creek Ln
- 2640 Carrington Dr
- 2213 Riley Ct
- 1914 Mitchell Place
- 4358 Creekview Dr
- 4386 Creekview Dr
- 2682 Inverness Dr
- 2690 Inverness Dr
- 2859 Pepperdine Dr
- 2706 Inverness Dr
- 2709 Inverness Dr
- 2713 Inverness Dr
- 2524 Hollington Dr
- 2525 Hollington Dr
- 2520 Hollington Dr
- 1701 Ethan Way
- 1703 Ethan Way
- 1518 Jonathan Place
- 1705 Ethan Way
- 1516 Jonathan Place
- 1707 Ethan Way
- 1507 Jonathan Place
- 1512 Jonathan Place
- 1704 Ethan Way
- 1709 Ethan Way
- 1706 Ethan Way
- 1510 Jonathan Place
- 1505 Jonathan Place
- 1353 Walton Loop
- 1711 Ethan Way
- 1351 Walton Loop
- 1710 Ethan Way
- 1355 Walton Loop
- 1508 Jonathan Place
- 1712 Ethan Way