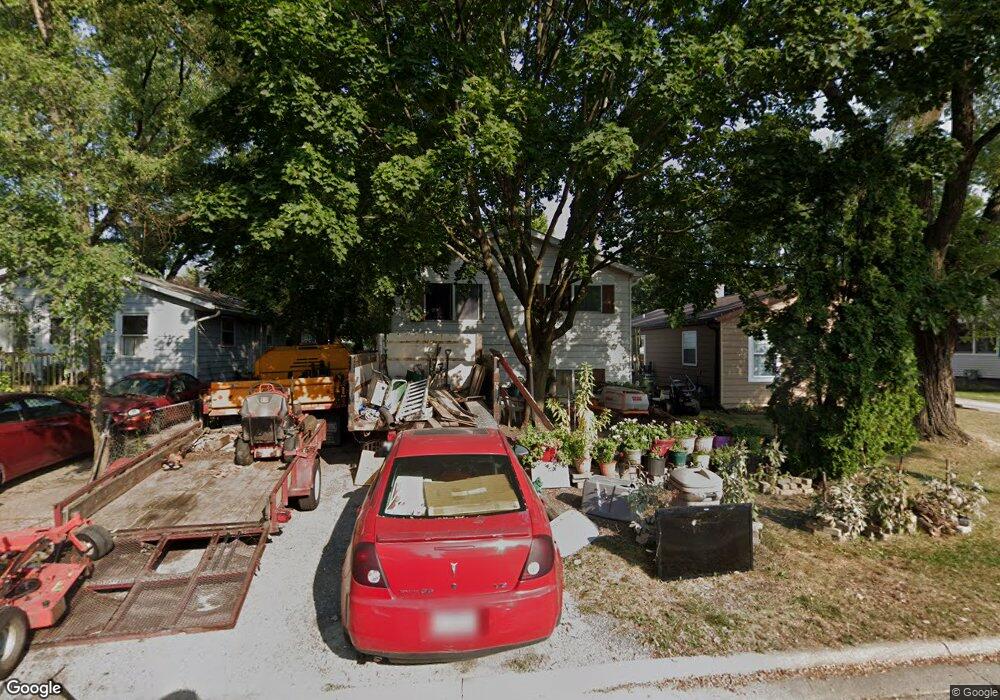
1513 Kildeer Dr Round Lake Beach, IL 60073
Estimated Value: $206,000 - $230,429
3
Beds
1
Bath
816
Sq Ft
$270/Sq Ft
Est. Value
About This Home
This home is located at 1513 Kildeer Dr, Round Lake Beach, IL 60073 and is currently estimated at $220,107, approximately $269 per square foot. 1513 Kildeer Dr is a home located in Lake County with nearby schools including Raymond Ellis Elementary School, Round Lake Middle School, and Round Lake High School.
Ownership History
Date
Name
Owned For
Owner Type
Purchase Details
Closed on
Oct 5, 2006
Sold by
Alvarado Arnulfo
Bought by
Alvarado Arnulfo and Alvarado Liboria
Current Estimated Value
Purchase Details
Closed on
May 12, 2006
Sold by
Alvarado Arnulfo and Alvarado Araceli
Bought by
Alvarado Arnulfo
Home Financials for this Owner
Home Financials are based on the most recent Mortgage that was taken out on this home.
Original Mortgage
$108,000
Outstanding Balance
$67,955
Interest Rate
7.96%
Mortgage Type
Purchase Money Mortgage
Estimated Equity
$152,152
Purchase Details
Closed on
Aug 1, 1994
Sold by
Weihe James and Weihe Deborah Ann
Bought by
Alvarado Arnulfo and Alvarado Araceli
Home Financials for this Owner
Home Financials are based on the most recent Mortgage that was taken out on this home.
Original Mortgage
$99,693
Interest Rate
8.53%
Mortgage Type
FHA
Create a Home Valuation Report for This Property
The Home Valuation Report is an in-depth analysis detailing your home's value as well as a comparison with similar homes in the area
Home Values in the Area
Average Home Value in this Area
Purchase History
| Date | Buyer | Sale Price | Title Company |
|---|---|---|---|
| Alvarado Arnulfo | -- | Ticor Title Insurance Co | |
| Alvarado Arnulfo | -- | Ticor Title Insurance Compan | |
| Alvarado Arnulfo | $100,000 | Attorneys Natl Title Network |
Source: Public Records
Mortgage History
| Date | Status | Borrower | Loan Amount |
|---|---|---|---|
| Open | Alvarado Arnulfo | $108,000 | |
| Closed | Alvarado Arnulfo | $99,693 |
Source: Public Records
Tax History Compared to Growth
Tax History
| Year | Tax Paid | Tax Assessment Tax Assessment Total Assessment is a certain percentage of the fair market value that is determined by local assessors to be the total taxable value of land and additions on the property. | Land | Improvement |
|---|---|---|---|---|
| 2024 | $3,860 | $63,685 | $8,653 | $55,032 |
| 2023 | $3,815 | $55,665 | $7,563 | $48,102 |
| 2022 | $3,815 | $49,385 | $6,588 | $42,797 |
| 2021 | $3,726 | $44,717 | $6,331 | $38,386 |
| 2020 | $3,526 | $42,547 | $6,024 | $36,523 |
| 2019 | $3,956 | $40,821 | $5,780 | $35,041 |
| 2018 | $3,890 | $36,081 | $5,445 | $30,636 |
| 2017 | $3,800 | $33,940 | $5,122 | $28,818 |
| 2016 | $3,619 | $31,330 | $4,728 | $26,602 |
| 2015 | $3,491 | $28,622 | $4,319 | $24,303 |
| 2014 | $3,931 | $32,344 | $4,379 | $27,965 |
| 2012 | $3,943 | $33,779 | $4,573 | $29,206 |
Source: Public Records
Map
Nearby Homes
- 1506 Brentwood Dr
- 1503 Cherokee Dr
- 1615 Cherokee Dr
- 933 Tomahawk Trail
- 630 Morningside Dr
- 24513 W Stub Ave
- 24536 W Stub Ave
- 1724 Lotus Dr
- 1813 Tomahawk Trail
- 908 Flintwood Ct
- 1110 N Fairfield Rd
- 24530 W Lake Shore Dr
- 1221 N Fairfield Rd
- 24576 W Norelius Ave
- 930 N Fairfield Rd
- 1248 N Red Oak Cir Unit 2
- 1610 Goldenrod Terrace
- 1316 N Red Oak Cir Unit 2
- 347 N Red Oak Cir Unit 406
- 1401 Meadowbrook Dr
- 1511 Kildeer Dr
- 1515 Kildeer Dr
- 1517 Kildeer Dr
- 1509 Kildeer Dr
- 1514 Brentwood Dr
- 1507 Kildeer Dr
- 1518 Brentwood Dr
- 1512 Brentwood Dr
- 1520 Brentwood Dr
- 1505 Kildeer Dr
- 1521 Kildeer Dr
- 1514 Kildeer Dr
- 1516 Kildeer Dr
- 1512 Kildeer Dr
- 1522 Brentwood Dr
- 1510 Kildeer Dr
- 1508 Brentwood Dr
- 1503 Kildeer Dr
- 1508 Kildeer Dr