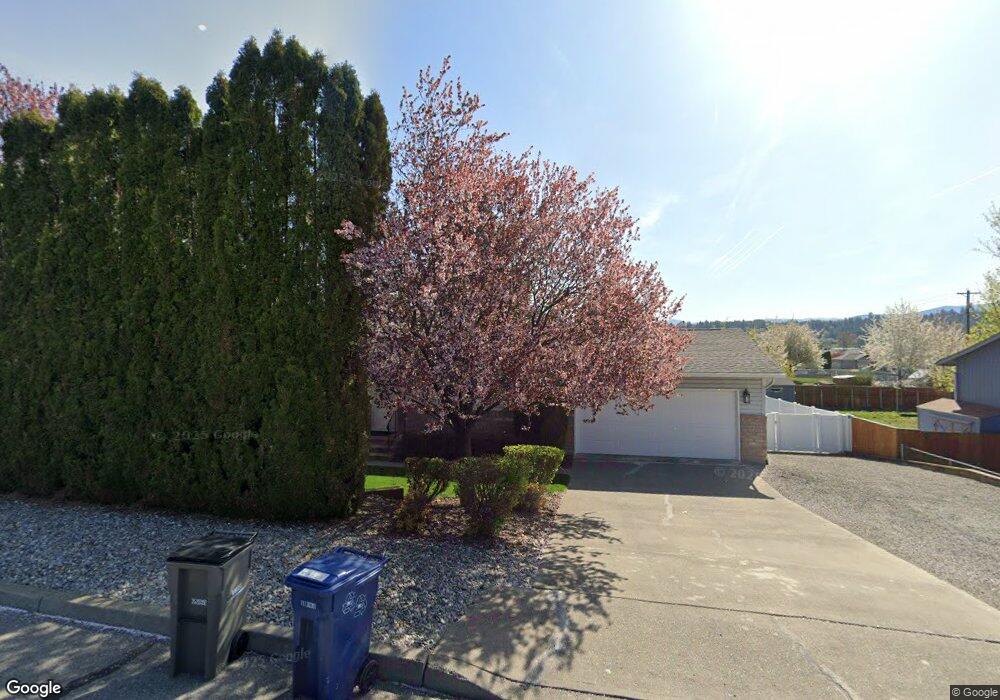
1513 S Progress Rd Spokane Valley, WA 99037
Estimated Value: $423,157 - $438,000
4
Beds
3
Baths
2,160
Sq Ft
$200/Sq Ft
Est. Value
About This Home
This home is located at 1513 S Progress Rd, Spokane Valley, WA 99037 and is currently estimated at $431,789, approximately $199 per square foot. 1513 S Progress Rd is a home located in Spokane County with nearby schools including Adams Elementary School, Evergreen Middle School, and Horizon Middle School.
Ownership History
Date
Name
Owned For
Owner Type
Purchase Details
Closed on
Jul 25, 2019
Sold by
Belangie Todd D and Belangie Elisa
Bought by
Belangie Michael T
Current Estimated Value
Home Financials for this Owner
Home Financials are based on the most recent Mortgage that was taken out on this home.
Original Mortgage
$100,000
Outstanding Balance
$87,609
Interest Rate
3.82%
Mortgage Type
New Conventional
Estimated Equity
$344,180
Purchase Details
Closed on
Aug 26, 2005
Sold by
Fournier Karen A
Bought by
Belangie Todd D and Belangie Elisa
Purchase Details
Closed on
Apr 14, 2003
Sold by
Fournier David E
Bought by
Fournier Karen A
Home Financials for this Owner
Home Financials are based on the most recent Mortgage that was taken out on this home.
Original Mortgage
$109,000
Interest Rate
5.6%
Mortgage Type
Purchase Money Mortgage
Purchase Details
Closed on
Jun 2, 1999
Sold by
Phillipson Andrew P and Phillipson Norene R
Bought by
Fournier Karen A and Fournier David E
Home Financials for this Owner
Home Financials are based on the most recent Mortgage that was taken out on this home.
Original Mortgage
$109,816
Interest Rate
6.84%
Mortgage Type
FHA
Create a Home Valuation Report for This Property
The Home Valuation Report is an in-depth analysis detailing your home's value as well as a comparison with similar homes in the area
Home Values in the Area
Average Home Value in this Area
Purchase History
| Date | Buyer | Sale Price | Title Company |
|---|---|---|---|
| Belangie Michael T | $260,000 | First American Title | |
| Belangie Todd D | $165,800 | Spokane County Title Co | |
| Fournier Karen A | -- | Pacific Nw Title | |
| Fournier Karen A | $110,000 | -- |
Source: Public Records
Mortgage History
| Date | Status | Borrower | Loan Amount |
|---|---|---|---|
| Open | Belangie Michael T | $100,000 | |
| Previous Owner | Fournier Karen A | $109,000 | |
| Previous Owner | Fournier Karen A | $109,816 |
Source: Public Records
Tax History
| Year | Tax Paid | Tax Assessment Tax Assessment Total Assessment is a certain percentage of the fair market value that is determined by local assessors to be the total taxable value of land and additions on the property. | Land | Improvement |
|---|---|---|---|---|
| 2025 | $4,011 | $371,700 | $110,000 | $261,700 |
| 2024 | $4,011 | $376,000 | $100,000 | $276,000 |
| 2023 | $3,507 | $373,300 | $85,000 | $288,300 |
| 2022 | $3,566 | $366,200 | $80,000 | $286,200 |
| 2021 | $3,258 | $261,100 | $60,000 | $201,100 |
| 2020 | $2,898 | $235,700 | $55,000 | $180,700 |
| 2019 | $2,458 | $208,500 | $55,000 | $153,500 |
| 2018 | $2,440 | $171,800 | $47,500 | $124,300 |
| 2017 | $2,312 | $165,700 | $47,500 | $118,200 |
| 2016 | $2,266 | $157,400 | $47,500 | $109,900 |
| 2015 | $2,295 | $156,700 | $42,500 | $114,200 |
| 2014 | -- | $156,700 | $42,500 | $114,200 |
| 2013 | -- | $0 | $0 | $0 |
Source: Public Records
Map
Nearby Homes
- 1714 S Newer Ln
- 1714 S S Progress Rd
- 1709 S Burns Rd
- 1716 S Progress Rd
- 15421 E 14th Ave
- 1948 S Century Ln
- 1946 S Century Ln
- 2015 S Early Dawn Dr
- 14108 E 18th Ave
- 15806 E 23rd Ave
- 14406 E 7th Ave
- 1210 S Tornig Ln
- 14315 E 24th Ave
- 2610 S Timberlane Dr
- 706 S Shelley Lake Ln
- 14411 E 5th Ave
- 2722 S Cheryl Ct
- 2407 S Early Dawn Ln
- 1909 S Davis Rd
- 15621 E Saltese Rd
- 1505 S Progress Rd
- 1521 S Progress Rd
- 1509 S Saint Charles Rd
- 1513 S St Charles St
- 1520 S Progress Rd
- 1505 S St Charles Rd
- 1505 S Street Charles St
- 15121 E 16th Ave
- 1510 S Progress Rd
- 1421 S Progress Rd
- 1424 S Progress Rd
- 15005 E 16th Ave
- 15207 E 17th Ct
- 15205 E 16th Ave
- 15201 E 17th Ct
- 1604 S Progress Rd
- 15205 E 15th Ave
- 1411 S Progress Rd
- 15213 E 17th Ct
- 1406 S Progress Rd
Your Personal Tour Guide
Ask me questions while you tour the home.