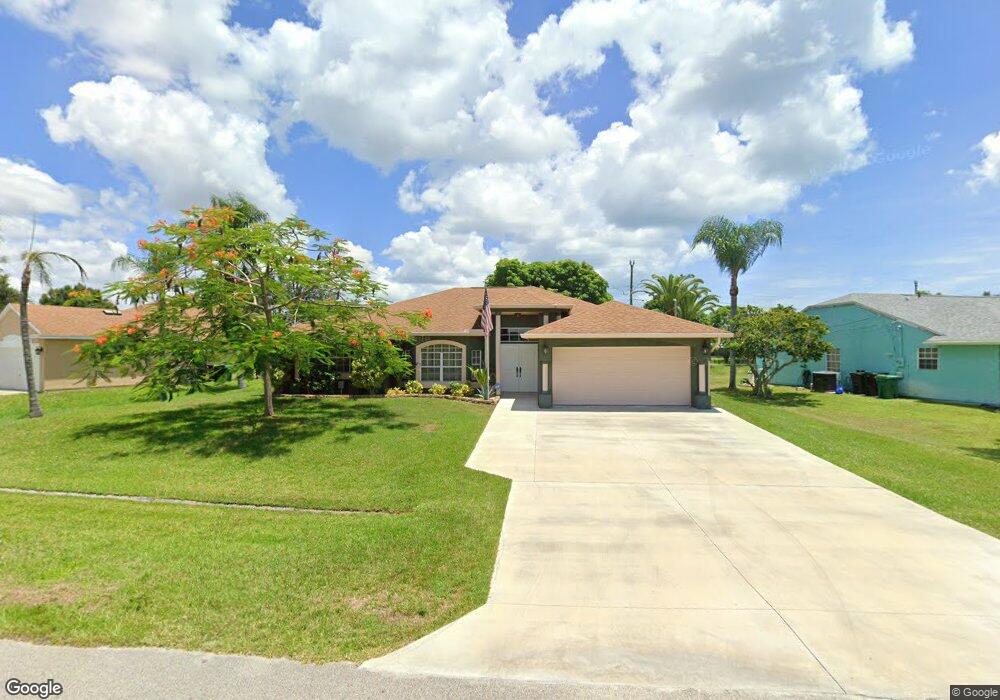
1513 SE North Blackwell Dr Port Saint Lucie, FL 34952
Sandhill Crossing NeighborhoodEstimated Value: $355,000 - $419,000
3
Beds
2
Baths
1,823
Sq Ft
$214/Sq Ft
Est. Value
About This Home
This home is located at 1513 SE North Blackwell Dr, Port Saint Lucie, FL 34952 and is currently estimated at $390,479, approximately $214 per square foot. 1513 SE North Blackwell Dr is a home located in St. Lucie County with nearby schools including Mariposa Elementary School, Morningside Elementary School, and Floresta Elementary School.
Ownership History
Date
Name
Owned For
Owner Type
Purchase Details
Closed on
Dec 18, 2009
Sold by
Herd Benjamin E and Herd Anu
Bought by
Willinger John and Willinger Debra
Current Estimated Value
Purchase Details
Closed on
Mar 16, 2007
Sold by
Goltz Randall and Goltz Nancy
Bought by
Herd Benjamin E and Herd Anu
Home Financials for this Owner
Home Financials are based on the most recent Mortgage that was taken out on this home.
Original Mortgage
$215,000
Interest Rate
8.37%
Mortgage Type
Purchase Money Mortgage
Purchase Details
Closed on
Jun 11, 2004
Sold by
Demonte Vito
Bought by
Goltz Randall and Goltz Nancy
Purchase Details
Closed on
Mar 30, 2001
Sold by
Demonte Raffaele and Demonte Grace
Bought by
Demonte Vito
Home Financials for this Owner
Home Financials are based on the most recent Mortgage that was taken out on this home.
Original Mortgage
$80,000
Interest Rate
7.02%
Create a Home Valuation Report for This Property
The Home Valuation Report is an in-depth analysis detailing your home's value as well as a comparison with similar homes in the area
Home Values in the Area
Average Home Value in this Area
Purchase History
| Date | Buyer | Sale Price | Title Company |
|---|---|---|---|
| Willinger John | $95,000 | First International Title In | |
| Herd Benjamin E | $215,000 | All Florida Land Title Co | |
| Goltz Randall | $190,000 | Chelsea Title Company | |
| Demonte Vito | $100,000 | -- |
Source: Public Records
Mortgage History
| Date | Status | Borrower | Loan Amount |
|---|---|---|---|
| Previous Owner | Herd Benjamin E | $215,000 | |
| Previous Owner | Demonte Vito | $80,000 |
Source: Public Records
Tax History Compared to Growth
Tax History
| Year | Tax Paid | Tax Assessment Tax Assessment Total Assessment is a certain percentage of the fair market value that is determined by local assessors to be the total taxable value of land and additions on the property. | Land | Improvement |
|---|---|---|---|---|
| 2024 | $2,334 | $122,313 | -- | -- |
| 2023 | $2,334 | $118,751 | $0 | $0 |
| 2022 | $2,211 | $115,293 | $0 | $0 |
| 2021 | $2,111 | $111,935 | $0 | $0 |
| 2020 | $2,112 | $110,390 | $0 | $0 |
| 2019 | $2,083 | $107,909 | $0 | $0 |
| 2018 | $1,968 | $105,897 | $0 | $0 |
| 2017 | $1,940 | $160,300 | $35,600 | $124,700 |
| 2016 | $1,906 | $141,900 | $26,800 | $115,100 |
| 2015 | $1,920 | $118,100 | $21,000 | $97,100 |
| 2014 | $1,831 | $100,079 | $0 | $0 |
Source: Public Records
Map
Nearby Homes
- 1682 SE Berkshire Blvd
- 1744 SE Berkshire Blvd
- 1520 SE Mariana Rd
- 1785 SE Berkshire Blvd
- 2707 SE Rawlings Rd
- 2873 SE Rawlings Rd
- 2533 SE Grand Dr
- 2565 SE Dogwood Ave
- 2718 SE Buccaneer Cir
- 1645 SE North Blackwell Dr
- 1902 SE Dranson Cir
- 2443 SE Tracy Ave
- 1857 SE Bowie St
- 2492 SE Rival Ave
- 2830 SE Cabana Ln
- 2885 SE Cabana Ln
- 1669 SE North Blackwell Dr
- 2430 SE Tiffany Ave
- 2849 SE Buccaneer Cir
- 2448 SE Pascal Ave
- 1507 SE North Blackwell Dr
- 1519 SE North Blackwell Dr
- 1501 SE North Blackwell Dr
- 1514 SE North Blackwell Dr
- 1520 SE North Blackwell Dr
- 1649 SE Berkshire Blvd
- 1526 SE North Blackwell Dr
- 1531 SE North Blackwell Dr
- 1532 SE North Blackwell Dr
- 1637 SE Berkshire Blvd
- 1537 SE North Blackwell Dr
- 2601 SE Creston Ln
- 1538 SE North Blackwell Dr
- 2637 SE Creston Ln
- 2619 SE Creston Ln
- 1662 SE Berkshire Blvd
- 1625 SE Berkshire Blvd
- 1543 SE North Blackwell Dr
- 2673 SE Creston Ln