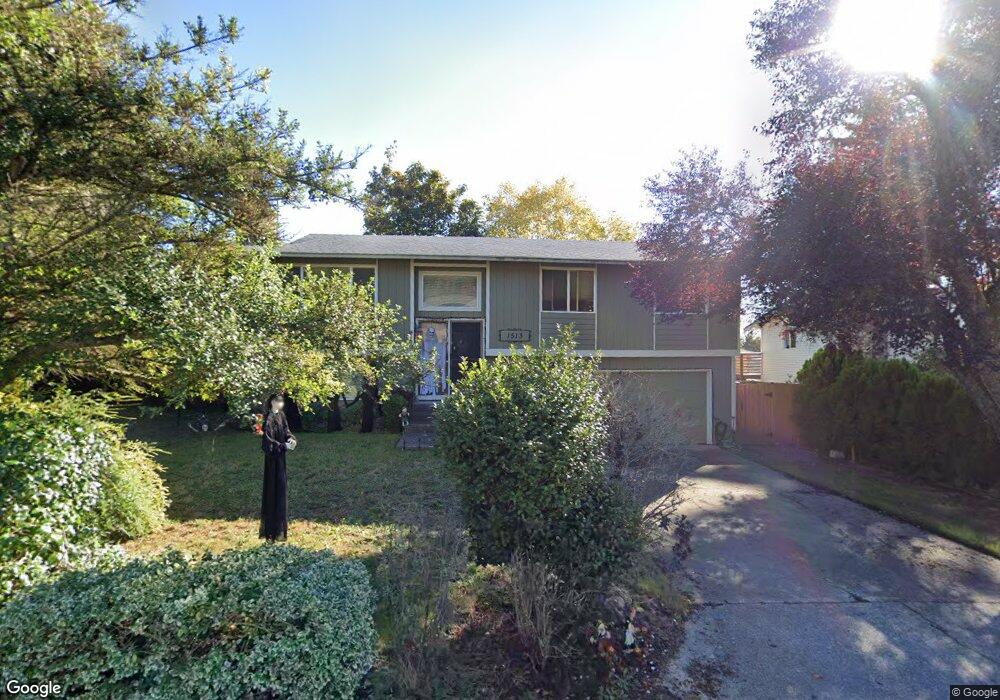
1513 Vue Ct Bremerton, WA 98310
Estimated Value: $462,000 - $483,000
3
Beds
2
Baths
1,516
Sq Ft
$309/Sq Ft
Est. Value
About This Home
This home is located at 1513 Vue Ct, Bremerton, WA 98310 and is currently estimated at $468,886, approximately $309 per square foot. 1513 Vue Ct is a home located in Kitsap County with nearby schools including View Ridge Elementary School, Mountain View Middle School, and Bremerton High School.
Ownership History
Date
Name
Owned For
Owner Type
Purchase Details
Closed on
May 10, 2018
Sold by
Reeves James C
Bought by
Fields Charles L and Fields Elena F
Current Estimated Value
Home Financials for this Owner
Home Financials are based on the most recent Mortgage that was taken out on this home.
Original Mortgage
$270,019
Outstanding Balance
$238,072
Interest Rate
5.5%
Mortgage Type
FHA
Estimated Equity
$230,814
Purchase Details
Closed on
Dec 12, 2012
Sold by
Reeves Melissa A
Bought by
Reeves James C
Purchase Details
Closed on
Sep 8, 2005
Sold by
Kelly Steven R
Bought by
Reeves James C and Reeves Melissa A
Home Financials for this Owner
Home Financials are based on the most recent Mortgage that was taken out on this home.
Original Mortgage
$215,122
Interest Rate
5.7%
Mortgage Type
VA
Create a Home Valuation Report for This Property
The Home Valuation Report is an in-depth analysis detailing your home's value as well as a comparison with similar homes in the area
Home Values in the Area
Average Home Value in this Area
Purchase History
| Date | Buyer | Sale Price | Title Company |
|---|---|---|---|
| Fields Charles L | $275,000 | Pacific Northwest Title Silv | |
| Reeves James C | -- | None Available | |
| Reeves James C | $208,530 | Transnation Title Ins Co |
Source: Public Records
Mortgage History
| Date | Status | Borrower | Loan Amount |
|---|---|---|---|
| Open | Fields Charles L | $270,019 | |
| Previous Owner | Reeves James C | $215,122 |
Source: Public Records
Tax History Compared to Growth
Tax History
| Year | Tax Paid | Tax Assessment Tax Assessment Total Assessment is a certain percentage of the fair market value that is determined by local assessors to be the total taxable value of land and additions on the property. | Land | Improvement |
|---|---|---|---|---|
| 2026 | $3,563 | $403,850 | $96,240 | $307,610 |
| 2025 | $3,563 | $403,850 | $96,240 | $307,610 |
| 2024 | $3,438 | $403,850 | $96,240 | $307,610 |
| 2023 | $3,553 | $403,850 | $96,240 | $307,610 |
| 2022 | $3,294 | $336,540 | $80,200 | $256,340 |
| 2021 | $3,158 | $295,300 | $53,550 | $241,750 |
| 2020 | $2,957 | $276,310 | $49,930 | $226,380 |
| 2019 | $2,571 | $248,880 | $44,860 | $204,020 |
| 2018 | $2,856 | $192,480 | $36,180 | $156,300 |
| 2017 | $2,520 | $192,480 | $36,180 | $156,300 |
| 2016 | $2,367 | $171,080 | $31,740 | $139,340 |
| 2015 | $2,148 | $154,510 | $32,150 | $122,360 |
| 2014 | -- | $147,930 | $32,150 | $115,780 |
| 2013 | -- | $158,080 | $34,400 | $123,680 |
Source: Public Records
Map
Nearby Homes
- 1802 NE Windermere Dr
- 4209 Westview Dr NE
- 1800 NE Riddell Rd
- 1312 E Hope St
- 5307 Washington 303 Unit 180
- 5307 Washington 303 Unit 126
- 3525 Harbel Dr NE
- 3621 Wheaton Way
- 704 NE Normandy Dr
- 175 NE Camelot Dr
- 802 Hanford Ave
- 937 Pearl St
- 638 Shirehill St
- 3709 Trenton Ave NE
- 5600 Wisteria Ln NE
- 3316 Perry Ave
- 3835 Earendale Ave
- 3975 Fischer Park Ave NE
- 3467 Partridge Hollow NE
- 3237 Perry Ave NE