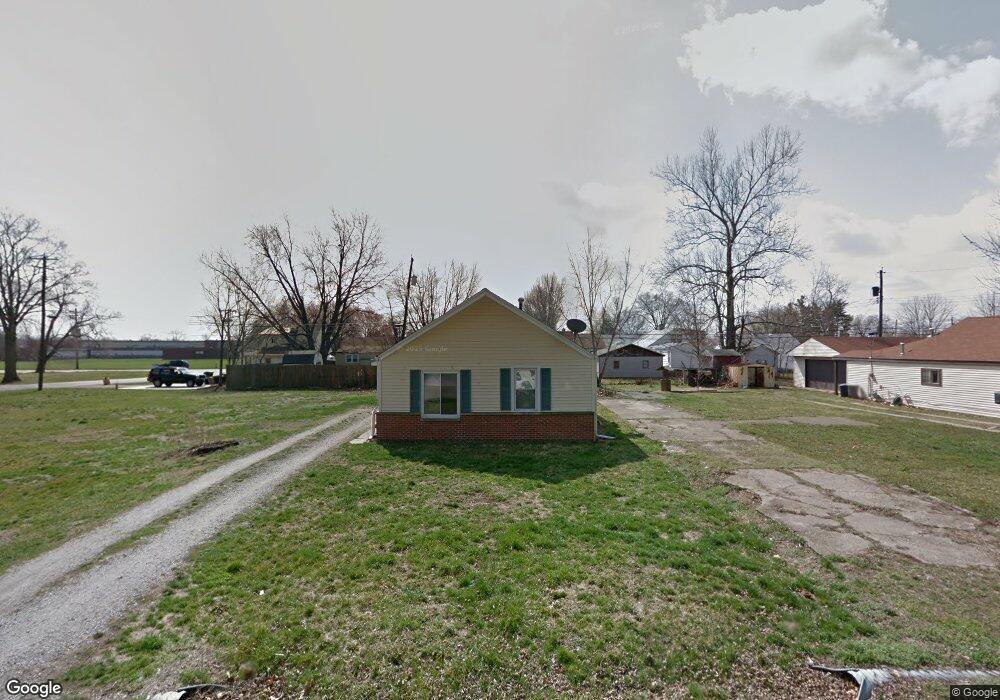
1513 W Waggoner St Decatur, IL 62526
Ravina Park NeighborhoodEstimated Value: $42,988 - $54,000
2
Beds
1
Bath
796
Sq Ft
$59/Sq Ft
Est. Value
About This Home
This home is located at 1513 W Waggoner St, Decatur, IL 62526 and is currently estimated at $46,997, approximately $59 per square foot. 1513 W Waggoner St is a home located in Macon County with nearby schools including Stephen Decatur Middle School and Northwest Christian Campus.
Ownership History
Date
Name
Owned For
Owner Type
Purchase Details
Closed on
Mar 29, 2018
Sold by
Barrar Howard and Barrar Mary
Bought by
Barrar Trust
Current Estimated Value
Purchase Details
Closed on
May 10, 2011
Sold by
Secretary Of Hud
Bought by
Barrar Howard and Barrar Mary
Purchase Details
Closed on
May 1, 2011
Purchase Details
Closed on
Feb 23, 2010
Sold by
Robinson Jocelyn O C and Robinson Jocelyn
Bought by
Secretary Of Hud
Purchase Details
Closed on
Oct 31, 2008
Sold by
Conaway Frank
Bought by
Robinson Jocelyn O C
Home Financials for this Owner
Home Financials are based on the most recent Mortgage that was taken out on this home.
Original Mortgage
$49,492
Interest Rate
6.11%
Mortgage Type
FHA
Purchase Details
Closed on
Jun 27, 2008
Sold by
Robertson Jo Ellen
Bought by
Conaway Frank
Home Financials for this Owner
Home Financials are based on the most recent Mortgage that was taken out on this home.
Original Mortgage
$35,200
Interest Rate
6.05%
Mortgage Type
Credit Line Revolving
Create a Home Valuation Report for This Property
The Home Valuation Report is an in-depth analysis detailing your home's value as well as a comparison with similar homes in the area
Home Values in the Area
Average Home Value in this Area
Purchase History
| Date | Buyer | Sale Price | Title Company |
|---|---|---|---|
| Barrar Trust | -- | None Available | |
| Barrar Howard | -- | None Available | |
| -- | $11,500 | -- | |
| Secretary Of Hud | $59,780 | None Available | |
| Robinson Jocelyn O C | $50,000 | None Available | |
| Conaway Frank | $18,000 | None Available |
Source: Public Records
Mortgage History
| Date | Status | Borrower | Loan Amount |
|---|---|---|---|
| Previous Owner | Robinson Jocelyn O C | $49,492 | |
| Previous Owner | Conaway Frank | $35,200 |
Source: Public Records
Tax History Compared to Growth
Tax History
| Year | Tax Paid | Tax Assessment Tax Assessment Total Assessment is a certain percentage of the fair market value that is determined by local assessors to be the total taxable value of land and additions on the property. | Land | Improvement |
|---|---|---|---|---|
| 2024 | $864 | $8,930 | $1,677 | $7,253 |
| 2023 | $857 | $8,614 | $1,618 | $6,996 |
| 2022 | $815 | $7,971 | $1,497 | $6,474 |
| 2021 | $766 | $7,444 | $1,398 | $6,046 |
| 2020 | $755 | $7,098 | $1,333 | $5,765 |
| 2019 | $755 | $7,098 | $1,333 | $5,765 |
| 2018 | $737 | $7,012 | $1,754 | $5,258 |
| 2017 | $754 | $7,199 | $1,801 | $5,398 |
| 2016 | $768 | $7,272 | $1,819 | $5,453 |
| 2015 | $730 | $7,144 | $1,787 | $5,357 |
| 2014 | $678 | $7,073 | $1,769 | $5,304 |
| 2013 | $766 | $8,020 | $1,835 | $6,185 |
Source: Public Records
Map
Nearby Homes
- 1645 W Center St
- 1319 W Waggoner St
- 1530 W Cushing St
- 1535 N Mcclellan Ave
- 1675 W Center St
- 1415 N Dennis Ave
- 1706 W Division St
- 1451 W Marietta St
- 1524 N Summit Ave
- 1625 W Garfield Ave
- 917 N Wilder Ave
- 2192 W Waggoner St
- 2195 W Center St
- 2209 W Center St
- 933 W Division St
- 2125 Clearmont Ave
- 2201 W Packard St
- 2231 W Packard St
- 2121 Barding Ave
- 1065 W Green St
- 1535 W Waggoner St
- 1524 W Grand Ave
- 1547 W Waggoner St
- 1520 W Waggoner St
- 1534 W Grand Ave
- 1536 W Waggoner St
- 1512 W Grand Ave
- 1530 W Grand Ave
- 1401 N Mcclellan Ave
- 1502 W Grand Ave
- 1555 W Waggoner St
- 1538 W Grand Ave
- 1401 N Mcclellan St
- 1427 W Waggoner St
- 1542 W Grand Ave
- 1575 W Waggoner St
- 1546 W Grand Ave
- 1426 W Waggoner St
- 1585 W Waggoner St
- 1550 W Waggoner St