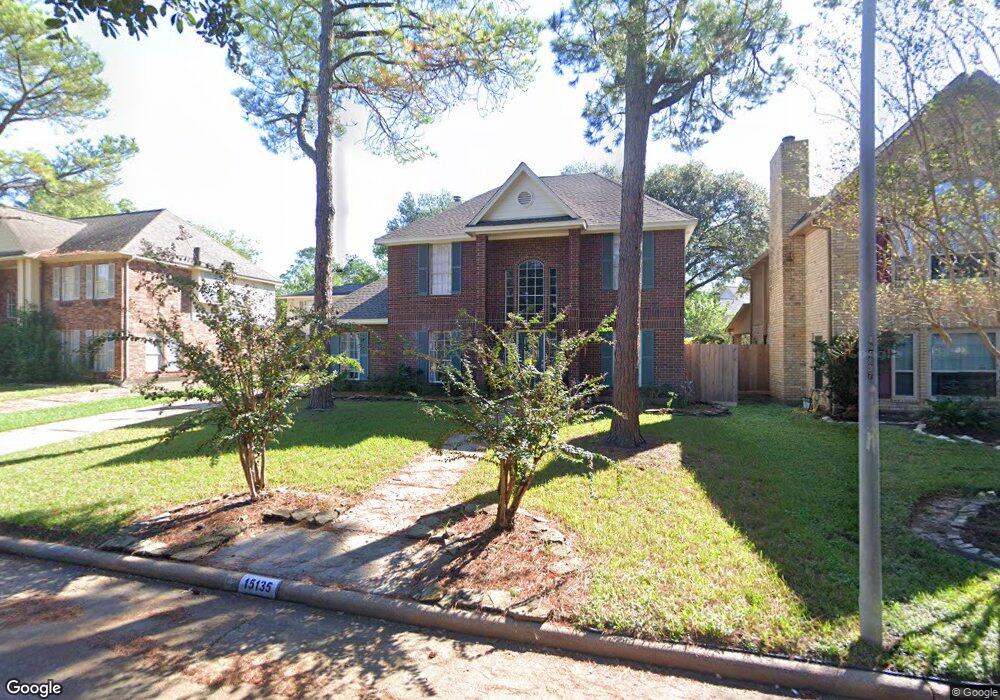
15135 Easton Park Dr Houston, TX 77095
Copperfield NeighborhoodEstimated Value: $320,000 - $352,238
4
Beds
3
Baths
2,460
Sq Ft
$137/Sq Ft
Est. Value
About This Home
This home is located at 15135 Easton Park Dr, Houston, TX 77095 and is currently estimated at $337,560, approximately $137 per square foot. 15135 Easton Park Dr is a home located in Harris County with nearby schools including Owens Elementary School, Labay Middle School, and Cypress Falls High School.
Ownership History
Date
Name
Owned For
Owner Type
Purchase Details
Closed on
May 2, 2014
Sold by
Creech John David and Creech Stephanie Theresa
Bought by
Rupp Travis W and Rupp Jessica H
Current Estimated Value
Home Financials for this Owner
Home Financials are based on the most recent Mortgage that was taken out on this home.
Original Mortgage
$171,008
Outstanding Balance
$130,814
Interest Rate
4.43%
Mortgage Type
VA
Estimated Equity
$206,746
Purchase Details
Closed on
Jun 23, 2010
Sold by
Collerain Joseph B and Collerain Kim J
Bought by
Creech John David and Creech Stephanie Theresa
Purchase Details
Closed on
Jun 26, 1997
Sold by
Maczka Michael J and Maczka Laura G
Bought by
Collerain Joseph B and Collerain Kim J
Home Financials for this Owner
Home Financials are based on the most recent Mortgage that was taken out on this home.
Original Mortgage
$113,500
Interest Rate
7.92%
Create a Home Valuation Report for This Property
The Home Valuation Report is an in-depth analysis detailing your home's value as well as a comparison with similar homes in the area
Home Values in the Area
Average Home Value in this Area
Purchase History
| Date | Buyer | Sale Price | Title Company |
|---|---|---|---|
| Rupp Travis W | -- | None Available | |
| Creech John David | -- | American Title Company | |
| Collerain Joseph B | -- | First American Title |
Source: Public Records
Mortgage History
| Date | Status | Borrower | Loan Amount |
|---|---|---|---|
| Open | Rupp Travis W | $171,008 | |
| Previous Owner | Collerain Joseph B | $113,500 |
Source: Public Records
Tax History Compared to Growth
Tax History
| Year | Tax Paid | Tax Assessment Tax Assessment Total Assessment is a certain percentage of the fair market value that is determined by local assessors to be the total taxable value of land and additions on the property. | Land | Improvement |
|---|---|---|---|---|
| 2025 | $4,435 | $329,015 | $61,295 | $267,720 |
| 2024 | $4,435 | $342,464 | $61,295 | $281,169 |
| 2023 | $4,435 | $319,859 | $61,295 | $258,564 |
| 2022 | $6,083 | $299,342 | $48,969 | $250,373 |
| 2021 | $5,827 | $242,653 | $48,969 | $193,684 |
| 2020 | $5,546 | $224,764 | $34,978 | $189,786 |
| 2019 | $5,562 | $218,300 | $27,300 | $191,000 |
| 2018 | $1,982 | $203,334 | $27,300 | $176,034 |
| 2017 | $5,197 | $203,334 | $27,300 | $176,034 |
| 2016 | $4,805 | $188,015 | $22,523 | $165,492 |
| 2015 | $3,275 | $188,015 | $22,523 | $165,492 |
| 2014 | $3,275 | $0 | $0 | $0 |
Source: Public Records
Map
Nearby Homes
- 15131 New Hastings Dr
- 15010 Chetland Place Dr
- 8211 Riverglade Dr
- 14931 Inverrary Dr
- 14919 Forest Trails Dr
- 7827 Alamar Dr
- 15339 Glenwood Park Dr
- 7731 Club Lake Dr
- 14911 Sandalfoot St
- 8203 Green Devon Dr
- 15611 Meadow Village Dr
- 15362 Meadow Village Dr
- 15854 Knolls Lodge Dr
- 15415 Swan Creek Dr
- 15414 Swan Creek Dr
- 8043 Oceanside Dr
- 7637 Ameswood Rd
- Highway 6 N & Huffmeister Rd
- 15918 Pinyon Creek Dr
- 7418 Benwich Cir
- 15131 Easton Park Dr
- 15139 Easton Park Dr
- 15130 Chetland Place Dr
- 15126 Chetland Place Dr
- 15127 Easton Park Dr
- 15134 Chetland Place Dr
- 15143 Easton Park Dr
- 15138 Easton Park Dr
- 15134 Easton Park Dr
- 15122 Chetland Place Dr
- 15142 Easton Park Dr
- 15123 Easton Park Dr
- 15130 Easton Park Dr
- 15146 Easton Park Dr
- 15118 Chetland Place Dr
- 15126 Easton Park Dr
- 15119 Easton Park Dr
- 15222 New Hastings Dr
- 15131 Chetland Place Dr
- 15207 New Hastings Dr