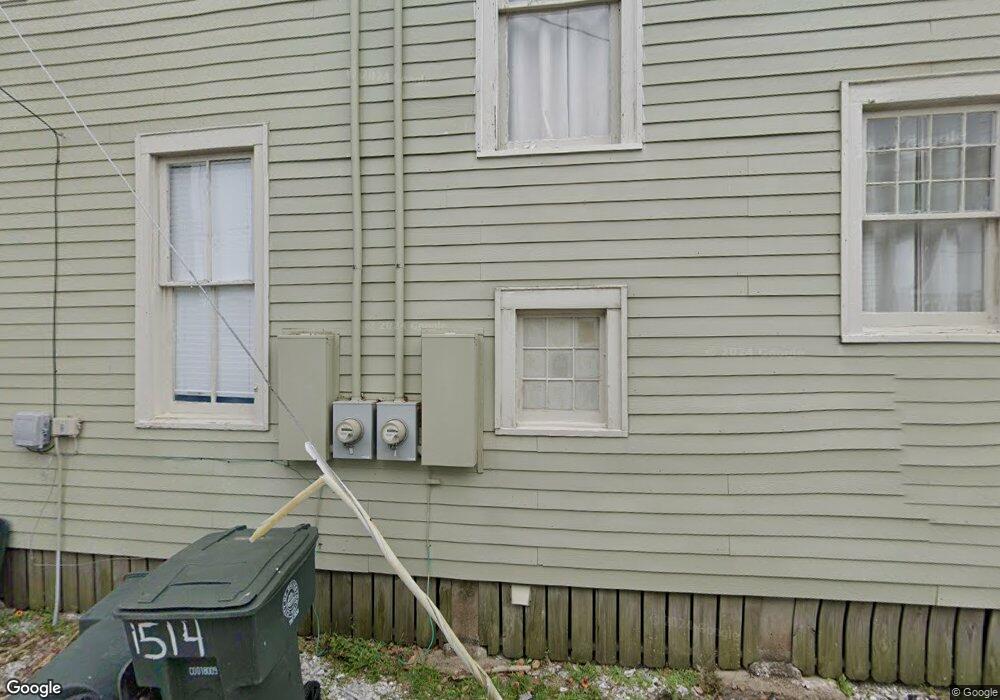
1514 15th St Unit 2 Galveston, TX 77550
San Jacinto NeighborhoodEstimated Value: $518,000 - $581,000
3
Beds
4
Baths
1,400
Sq Ft
$385/Sq Ft
Est. Value
About This Home
This home is located at 1514 15th St Unit 2, Galveston, TX 77550 and is currently estimated at $539,357, approximately $385 per square foot. 1514 15th St Unit 2 is a home located in Galveston County with nearby schools including Morgan Elementary Magnet School, Burnet STREAM Magnet School, and Parker Elementary School.
Ownership History
Date
Name
Owned For
Owner Type
Purchase Details
Closed on
Dec 13, 2018
Sold by
Cooney Michael and Cooney Ruth
Bought by
Histroical Rentals 1 Llc
Current Estimated Value
Purchase Details
Closed on
Dec 11, 2015
Sold by
Diaz Danny M and Stoeckel Dennis C
Bought by
Cooney Michael
Purchase Details
Closed on
May 9, 2001
Sold by
Quigley Patrick S
Bought by
Diaz Danny N and Stoeckel Dennis C
Home Financials for this Owner
Home Financials are based on the most recent Mortgage that was taken out on this home.
Original Mortgage
$62,550
Interest Rate
6.83%
Mortgage Type
Commercial
Purchase Details
Closed on
Jun 30, 1998
Sold by
Druss Gary Roger and Druss Ellen Gail
Bought by
Quigley Patrick S
Home Financials for this Owner
Home Financials are based on the most recent Mortgage that was taken out on this home.
Original Mortgage
$44,900
Interest Rate
7.13%
Mortgage Type
Commercial
Create a Home Valuation Report for This Property
The Home Valuation Report is an in-depth analysis detailing your home's value as well as a comparison with similar homes in the area
Home Values in the Area
Average Home Value in this Area
Purchase History
| Date | Buyer | Sale Price | Title Company |
|---|---|---|---|
| Histroical Rentals 1 Llc | -- | None Available | |
| Cooney Michael | -- | South Land Title Llc | |
| Diaz Danny N | -- | Chicago Title | |
| Quigley Patrick S | -- | -- |
Source: Public Records
Mortgage History
| Date | Status | Borrower | Loan Amount |
|---|---|---|---|
| Previous Owner | Diaz Danny N | $62,550 | |
| Previous Owner | Quigley Patrick S | $44,900 |
Source: Public Records
Tax History Compared to Growth
Tax History
| Year | Tax Paid | Tax Assessment Tax Assessment Total Assessment is a certain percentage of the fair market value that is determined by local assessors to be the total taxable value of land and additions on the property. | Land | Improvement |
|---|---|---|---|---|
| 2025 | $7,672 | $520,040 | $51,040 | $469,000 |
| 2024 | $7,672 | $587,040 | $51,040 | $536,000 |
| 2023 | $7,672 | $369,410 | $39,450 | $329,960 |
| 2022 | $13,676 | $678,340 | $39,450 | $638,890 |
| 2021 | $5,474 | $242,000 | $39,450 | $202,550 |
| 2020 | $6,768 | $238,700 | $10,140 | $228,560 |
| 2019 | $4,809 | $195,000 | $10,140 | $184,860 |
| 2018 | $4,625 | $186,920 | $10,140 | $176,780 |
| 2017 | $4,231 | $173,070 | $10,140 | $162,930 |
| 2016 | $3,337 | $136,500 | $10,140 | $126,360 |
| 2015 | $3,317 | $134,000 | $9,020 | $124,980 |
| 2014 | $3,325 | $132,630 | $9,020 | $123,610 |
Source: Public Records
Map
Nearby Homes
- 1328 Ursuline St
- 1324 Ursuline St
- 1412 Avenue M 1 2
- 1523 Avenue O
- 1522 Seawall Blvd
- 1611 Avenue N 1/2
- 1518 Avenue M 1 2
- 1302 Avenue M 1 2
- 1623 Avenue N 1/2
- 1624 Avenue n 1/2
- 1624 Avenue North 1 2
- 1208 Ursuline St
- 1624 Ursuline St
- 1624 Avenue N
- 1309 Avenue M
- 1426 Avenue M
- 1418 Avenue M
- 1228 16th St
- 1619 Avenue M
- 1710 Avenue O
- 1514 15th St Unit UP
- 1514 15th St
- 1426 Avenue n 1/2
- 1426 Avenue North 1 2
- 1428 Avenue n 1/2
- 1512 15th St
- 1418 Avenue n 1/2
- 1416 Avenue North 1 2 Unit Rear
- 1416 Avenue North 1 2
- 1416 Avenue n 1/2
- 1416 Avenue n 1/2 Unit rear
- 1416 Avenue n 1/2 Unit B
- 1421 Avenue N
- 1416 Ursuline St
- 1419 N Unit Lower
- 1419 Avenue N
- 1419 Avenue N Unit down
- 1427 Ursuline St
- 1427 Avenue N
- 1414 Avenue n 1/2