Estimated Value: $139,000 - $201,495
3
Beds
1
Bath
1,296
Sq Ft
$141/Sq Ft
Est. Value
About This Home
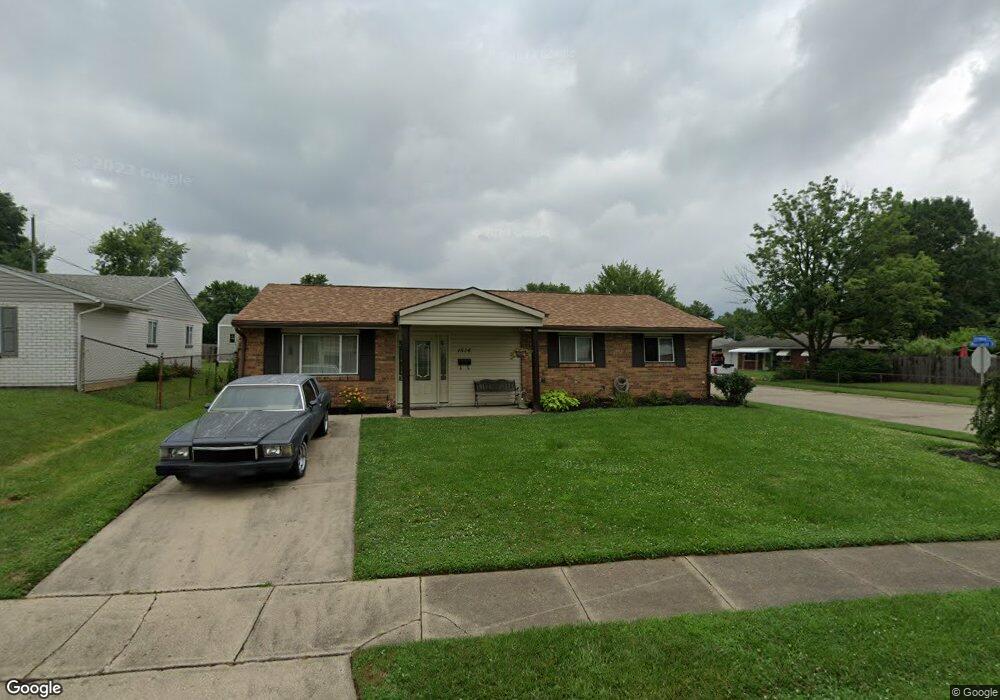
This home is located at 1514 Arrowhead Trail, Xenia, OH 45385 and is currently estimated at $183,374, approximately $141 per square foot. 1514 Arrowhead Trail is a home located in Greene County with nearby schools including Xenia High School, Summit Academy Community School for Alternative Learners - Xenia, and Legacy Christian Academy.
Ownership History
Date
Name
Owned For
Owner Type
Purchase Details
Closed on
Jul 25, 2016
Sold by
Fannie Mae
Bought by
Groves Ronnie J
Current Estimated Value
Home Financials for this Owner
Home Financials are based on the most recent Mortgage that was taken out on this home.
Original Mortgage
$77,077
Outstanding Balance
$61,498
Interest Rate
3.48%
Mortgage Type
FHA
Estimated Equity
$121,876
Purchase Details
Closed on
Jan 26, 2016
Bought by
Fannie Mae
Purchase Details
Closed on
Aug 18, 2006
Sold by
Dehaven Norman E and Dehaven Diana K
Bought by
Evans Jason S
Home Financials for this Owner
Home Financials are based on the most recent Mortgage that was taken out on this home.
Original Mortgage
$103,915
Interest Rate
6.88%
Mortgage Type
Unknown
Create a Home Valuation Report for This Property
The Home Valuation Report is an in-depth analysis detailing your home's value as well as a comparison with similar homes in the area
Home Values in the Area
Average Home Value in this Area
Purchase History
| Date | Buyer | Sale Price | Title Company |
|---|---|---|---|
| Groves Ronnie J | -- | None Available | |
| Fannie Mae | -- | -- | |
| Evans Jason S | $105,000 | None Available |
Source: Public Records
Mortgage History
| Date | Status | Borrower | Loan Amount |
|---|---|---|---|
| Open | Groves Ronnie J | $77,077 | |
| Previous Owner | Evans Jason S | $103,915 |
Source: Public Records
Tax History Compared to Growth
Tax History
| Year | Tax Paid | Tax Assessment Tax Assessment Total Assessment is a certain percentage of the fair market value that is determined by local assessors to be the total taxable value of land and additions on the property. | Land | Improvement |
|---|---|---|---|---|
| 2024 | $2,260 | $52,820 | $11,710 | $41,110 |
| 2023 | $2,260 | $52,820 | $11,710 | $41,110 |
| 2022 | $1,895 | $37,780 | $6,890 | $30,890 |
| 2021 | $1,921 | $37,780 | $6,890 | $30,890 |
| 2020 | $1,840 | $37,780 | $6,890 | $30,890 |
| 2019 | $1,610 | $31,110 | $6,630 | $24,480 |
| 2018 | $1,616 | $31,110 | $6,630 | $24,480 |
| 2017 | $1,485 | $31,110 | $6,630 | $24,480 |
| 2016 | $1,486 | $28,070 | $6,630 | $21,440 |
| 2015 | $745 | $28,070 | $6,630 | $21,440 |
| 2014 | $1,427 | $28,070 | $6,630 | $21,440 |
Source: Public Records
Map
Nearby Homes
- 1208 Bellbrook Ave
- 1272 Bellbrook Ave
- 1144 Rockwell Dr
- 1618 Navajo Dr
- 1778 Arapaho Dr
- 1342 Kylemore Dr
- 1568 Cheyenne Dr
- 1653 Seneca Dr
- 1233 June Dr
- 1223 June Dr
- 1769 Gayhart Dr
- 1283 June Dr
- 1391 June Dr
- 1866 Roxbury Dr
- 1829 Gayhart Dr
- 1908 Whitt St
- 2758 Wyoming Dr
- 121 S Progress Dr
- 305-325 Bellbrook Ave
- 523 Newport Rd
- 1526 Arrowhead Trail
- 882 Moccasin Trail
- 1538 Arrowhead Trail
- 1490 Arrowhead Trail
- 891 Moccasin Trail
- 868 Moccasin Trail
- 1527 Arrowhead Trail
- 887 Tomahawk Trail
- 1478 Arrowhead Trail
- 1552 Arrowhead Trail
- 879 Moccasin Trail
- 1541 Arrowhead Trail
- 1491 Arrowhead Trail
- 856 Moccasin Trail
- 865 Moccasin Trail
- 1462 Arrowhead Trail
- 1553 Arrowhead Trail
- 1479 Arrowhead Trail
- 861 Tomahawk Trail
- 884 Buckskin Trail