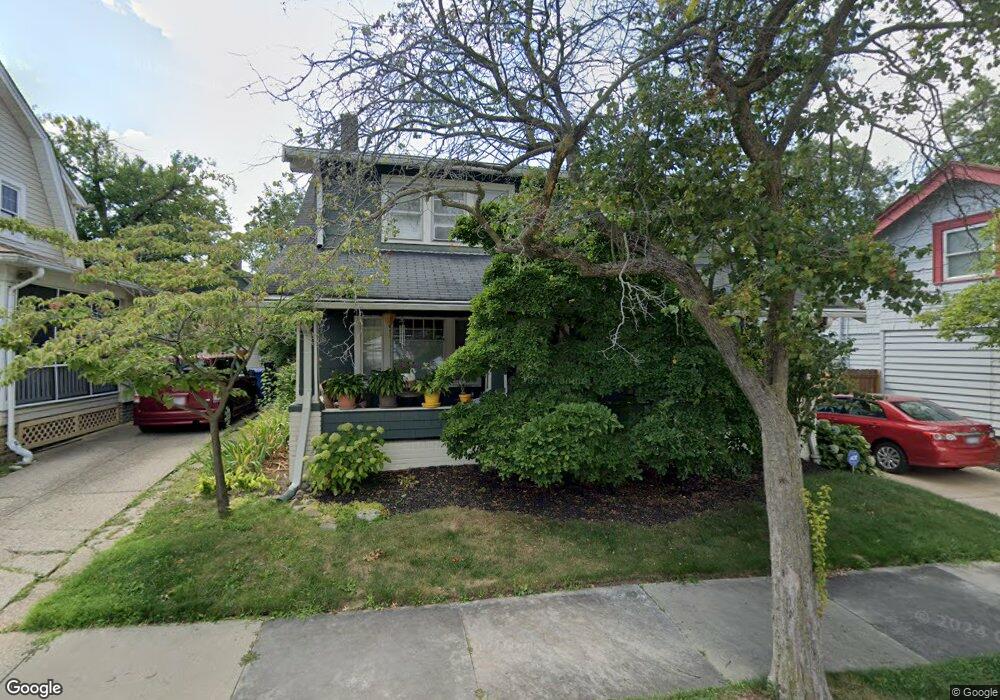
1514 Blossom Park Ave Lakewood, OH 44107
Estimated Value: $292,593 - $311,000
3
Beds
2
Baths
1,394
Sq Ft
$218/Sq Ft
Est. Value
About This Home
This home is located at 1514 Blossom Park Ave, Lakewood, OH 44107 and is currently estimated at $304,148, approximately $218 per square foot. 1514 Blossom Park Ave is a home located in Cuyahoga County with nearby schools including Grant Elementary School, Garfield Middle School, and Lakewood High School.
Ownership History
Date
Name
Owned For
Owner Type
Purchase Details
Closed on
Aug 30, 2000
Sold by
Gallagher Colleen A
Bought by
First Thomas and Christoff Andrea B
Current Estimated Value
Home Financials for this Owner
Home Financials are based on the most recent Mortgage that was taken out on this home.
Original Mortgage
$86,000
Outstanding Balance
$31,699
Interest Rate
8.26%
Estimated Equity
$272,449
Purchase Details
Closed on
Jun 16, 1998
Sold by
Crandell Thomas A and Crandell Teresa L
Bought by
Gallagher Colleen A
Home Financials for this Owner
Home Financials are based on the most recent Mortgage that was taken out on this home.
Original Mortgage
$92,000
Interest Rate
6.99%
Purchase Details
Closed on
May 24, 1994
Sold by
Boyle Augusta
Bought by
Crandell Thomas A
Purchase Details
Closed on
Jan 1, 1975
Bought by
Boyle Augusta
Create a Home Valuation Report for This Property
The Home Valuation Report is an in-depth analysis detailing your home's value as well as a comparison with similar homes in the area
Home Values in the Area
Average Home Value in this Area
Purchase History
| Date | Buyer | Sale Price | Title Company |
|---|---|---|---|
| First Thomas | $106,400 | Guardian Title | |
| Gallagher Colleen A | $97,000 | Resource Title Agency Inc | |
| Crandell Thomas A | $82,500 | -- | |
| Boyle Augusta | -- | -- |
Source: Public Records
Mortgage History
| Date | Status | Borrower | Loan Amount |
|---|---|---|---|
| Open | First Thomas | $86,000 | |
| Previous Owner | Gallagher Colleen A | $92,000 |
Source: Public Records
Tax History Compared to Growth
Tax History
| Year | Tax Paid | Tax Assessment Tax Assessment Total Assessment is a certain percentage of the fair market value that is determined by local assessors to be the total taxable value of land and additions on the property. | Land | Improvement |
|---|---|---|---|---|
| 2024 | $5,656 | $88,060 | $16,415 | $71,645 |
| 2023 | $4,534 | $60,410 | $13,860 | $46,550 |
| 2022 | $4,563 | $60,410 | $13,860 | $46,550 |
| 2021 | $4,516 | $60,410 | $13,860 | $46,550 |
| 2020 | $4,006 | $46,830 | $10,750 | $36,090 |
| 2019 | $3,927 | $133,800 | $30,700 | $103,100 |
| 2018 | $3,727 | $46,830 | $10,750 | $36,090 |
| 2017 | $3,558 | $38,610 | $8,230 | $30,380 |
| 2016 | $3,533 | $38,610 | $8,230 | $30,380 |
| 2015 | $3,537 | $38,610 | $8,230 | $30,380 |
| 2014 | $3,537 | $37,140 | $7,910 | $29,230 |
Source: Public Records
Map
Nearby Homes
- 1514 Olivewood Ave
- 1545 Marlowe Ave
- 1593 Marlowe Ave
- 1415 Olivewood Ave Unit 17
- 1532 Parkwood Rd
- 1675 Roosevelt Ave
- 1576 Wyandotte Ave
- 1458 Wyandotte Ave
- 1463 Wyandotte Ave
- 1480 Warren Rd Unit 313
- 1480 Warren Rd
- 1539 Elbur Ave
- 1314 Chase Ave
- 13532 Elbur Ln
- 1594 Victoria Ave
- 1304 Bunts Rd
- 2039 Richland Ave
- 1605 Lewis Dr
- 1337 Cook Ave
- 1503 Chesterland Ave
- 1508 Blossom Park Ave
- 1520 Blossom Park Ave
- 1517 Olivewood Ave
- 1523 Olivewood Ave
- 1504 Blossom Park Ave
- 1509 Olivewood Ave
- 1524 Blossom Park Ave
- 14224 Franklin Blvd Unit UP
- 1515 Blossom Park Ave
- 1521 Blossom Park Ave
- 1511 Blossom Park Ave
- 1505 Olivewood Ave
- 1525 Olivewood Ave
- 1505 Blossom Park Ave
- 1498 Blossom Park Ave
- 1525 Blossom Park Ave
- 1499 Olivewood Ave
- 1501 Olivewood Ave
- 1510 Olivewood Ave
- 1518 Olivewood Ave