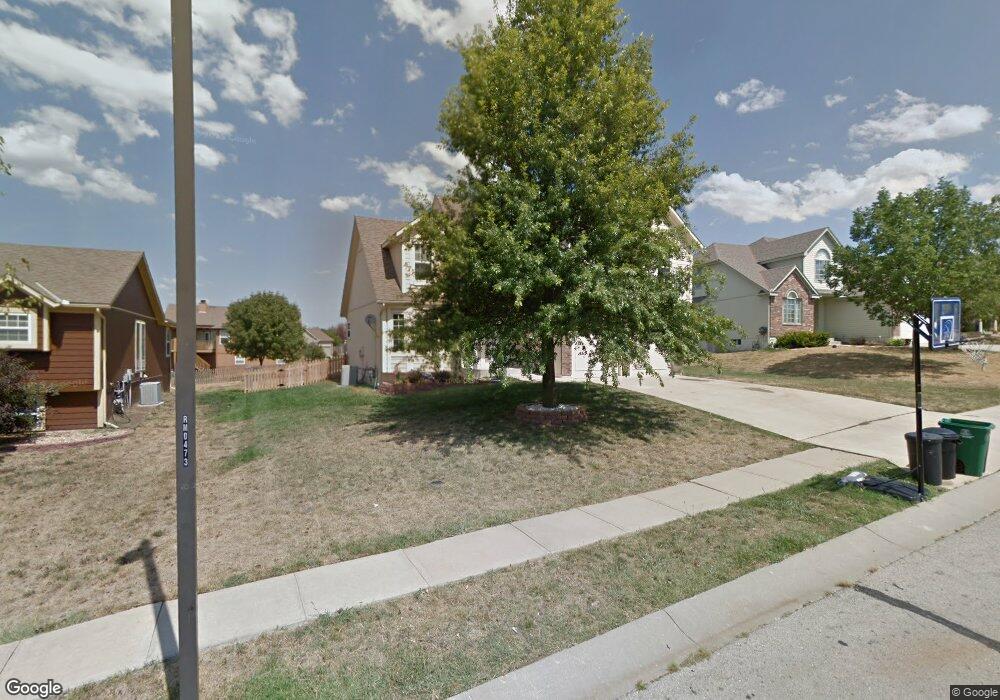
1514 Colt Cir Raymore, MO 64083
Estimated Value: $367,194 - $417,000
4
Beds
3
Baths
2,352
Sq Ft
$165/Sq Ft
Est. Value
About This Home
This home is located at 1514 Colt Cir, Raymore, MO 64083 and is currently estimated at $387,549, approximately $164 per square foot. 1514 Colt Cir is a home located in Cass County with nearby schools including Stonegate Elementary School, Raymore-Peculiar South Middle School, and Raymore-Peculiar Senior High School.
Ownership History
Date
Name
Owned For
Owner Type
Purchase Details
Closed on
Jan 25, 2008
Sold by
Saxon Mortgage Services Inc
Bought by
Reliford Andre L and Reliford Shantrel D
Current Estimated Value
Home Financials for this Owner
Home Financials are based on the most recent Mortgage that was taken out on this home.
Original Mortgage
$158,433
Outstanding Balance
$99,501
Interest Rate
6.15%
Mortgage Type
FHA
Estimated Equity
$288,048
Purchase Details
Closed on
Nov 20, 2007
Sold by
Ford Jennifer Lee
Bought by
Novastar Mortgage Inc
Purchase Details
Closed on
Apr 3, 2006
Sold by
Jp Morgan Chase Bank
Bought by
Ford Jennifer Lee
Home Financials for this Owner
Home Financials are based on the most recent Mortgage that was taken out on this home.
Original Mortgage
$169,900
Interest Rate
9.75%
Mortgage Type
Adjustable Rate Mortgage/ARM
Purchase Details
Closed on
Jun 28, 2005
Sold by
Lawyers Foreclosure Specialists Inc
Bought by
Jp Morgan Chase Bank and The Chase Manhattan Bank
Create a Home Valuation Report for This Property
The Home Valuation Report is an in-depth analysis detailing your home's value as well as a comparison with similar homes in the area
Home Values in the Area
Average Home Value in this Area
Purchase History
| Date | Buyer | Sale Price | Title Company |
|---|---|---|---|
| Reliford Andre L | -- | -- | |
| Novastar Mortgage Inc | $151,300 | -- | |
| Ford Jennifer Lee | -- | -- | |
| Jp Morgan Chase Bank | -- | -- |
Source: Public Records
Mortgage History
| Date | Status | Borrower | Loan Amount |
|---|---|---|---|
| Open | Reliford Andre L | $158,433 | |
| Previous Owner | Ford Jennifer Lee | $169,900 |
Source: Public Records
Tax History
| Year | Tax Paid | Tax Assessment Tax Assessment Total Assessment is a certain percentage of the fair market value that is determined by local assessors to be the total taxable value of land and additions on the property. | Land | Improvement |
|---|---|---|---|---|
| 2025 | $3,843 | $47,800 | $7,400 | $40,400 |
| 2024 | $3,843 | $42,370 | $6,730 | $35,640 |
| 2023 | $3,839 | $42,370 | $6,730 | $35,640 |
| 2022 | $3,474 | $37,630 | $6,730 | $30,900 |
| 2021 | $3,364 | $37,630 | $6,730 | $30,900 |
| 2020 | $3,295 | $36,130 | $6,730 | $29,400 |
| 2019 | $3,190 | $36,130 | $6,730 | $29,400 |
| 2018 | $2,952 | $32,030 | $5,610 | $26,420 |
| 2017 | $2,613 | $32,030 | $5,610 | $26,420 |
| 2016 | $2,613 | $29,330 | $5,610 | $23,720 |
| 2015 | $2,615 | $29,330 | $5,610 | $23,720 |
| 2014 | $2,616 | $29,330 | $5,610 | $23,720 |
| 2013 | -- | $29,330 | $5,610 | $23,720 |
Source: Public Records
Map
Nearby Homes
- 1519 Colt Cir
- 1510 Colt Cir
- 1717 Overbrook Ln
- 603 Old Paint Rd
- 414 Eagle Glen Dr
- 1105 Creekside Ct
- 1103 Carlisle Dr
- 411 Eagle Glen Dr
- 1108 Yokley Dr
- 709 Bluestem Ct
- 727 Country Ln
- 901 W Lucy Webb Rd
- 415 Woodview Dr
- 110 S Westglen Dr
- 1608 Cody Dr
- 300 Dean Ave
- 1601 Stasi Ave
- 817 Clancy Ct
- 212 S Huntsman Blvd
- 1228 Larkspur Place
- 1516 Colt Cir
- 1512 Colt Cir
- 1517 Wrangler Way
- 1519 Wrangler Way
- 1515 Wrangler Way
- 1518 Colt Cir
- 1515 Colt Cir
- 1513 Colt Cir
- 709 S Fox Ridge Dr
- 1517 Colt Cir
- 1513 Wrangler Way
- 1511 Colt Cir
- 1508 Colt Cir
- 1518 Wrangler Way
- 1516 Wrangler Way
- 1509 Colt Cir
- 1528 Horseshoe Dr
- 1507 Colt Cir
- 1520 Wrangler Way
- 1514 Wrangler Way
Your Personal Tour Guide
Ask me questions while you tour the home.