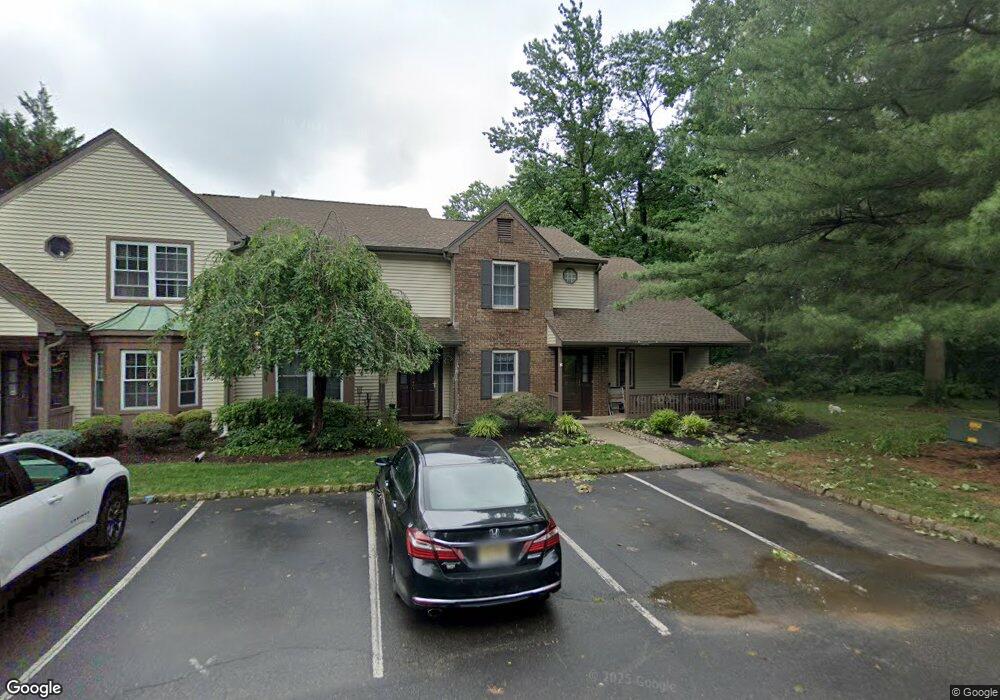
1514 Mahogany Ct Monmouth Junction, NJ 08852
Estimated Value: $446,169 - $497,000
3
Beds
3
Baths
1,484
Sq Ft
$319/Sq Ft
Est. Value
About This Home
This home is located at 1514 Mahogany Ct, Monmouth Junction, NJ 08852 and is currently estimated at $473,292, approximately $318 per square foot. 1514 Mahogany Ct is a home located in Middlesex County with nearby schools including Brooks Crossing Elementary School, Crossroads North Middle School, and South Brunswick High School.
Ownership History
Date
Name
Owned For
Owner Type
Purchase Details
Closed on
Aug 29, 2012
Sold by
Barlow Evan and Barlow Katri
Bought by
Kurkela Walter
Current Estimated Value
Purchase Details
Closed on
Aug 9, 2007
Sold by
Rader William G
Bought by
Barlow Evan T and Barlow Katri A
Home Financials for this Owner
Home Financials are based on the most recent Mortgage that was taken out on this home.
Original Mortgage
$55,000
Interest Rate
6.78%
Mortgage Type
New Conventional
Purchase Details
Closed on
Jun 3, 2003
Sold by
Mets James
Bought by
Rader William
Home Financials for this Owner
Home Financials are based on the most recent Mortgage that was taken out on this home.
Original Mortgage
$164,000
Interest Rate
5.46%
Purchase Details
Closed on
May 20, 1998
Sold by
Cakuls Mary
Bought by
Mets James and Mets Simona
Home Financials for this Owner
Home Financials are based on the most recent Mortgage that was taken out on this home.
Original Mortgage
$104,400
Interest Rate
7.02%
Create a Home Valuation Report for This Property
The Home Valuation Report is an in-depth analysis detailing your home's value as well as a comparison with similar homes in the area
Home Values in the Area
Average Home Value in this Area
Purchase History
| Date | Buyer | Sale Price | Title Company |
|---|---|---|---|
| Kurkela Walter | $209,100 | None Available | |
| Barlow Evan T | $275,000 | -- | |
| Rader William | $205,000 | -- | |
| Mets James | $116,000 | -- |
Source: Public Records
Mortgage History
| Date | Status | Borrower | Loan Amount |
|---|---|---|---|
| Previous Owner | Barlow Evan T | $55,000 | |
| Previous Owner | Barlow Evan T | $220,000 | |
| Previous Owner | Rader William | $164,000 | |
| Previous Owner | Mets James | $104,400 |
Source: Public Records
Tax History Compared to Growth
Tax History
| Year | Tax Paid | Tax Assessment Tax Assessment Total Assessment is a certain percentage of the fair market value that is determined by local assessors to be the total taxable value of land and additions on the property. | Land | Improvement |
|---|---|---|---|---|
| 2025 | $5,688 | $105,300 | $60,000 | $45,300 |
| 2024 | $5,484 | $105,300 | $60,000 | $45,300 |
| 2023 | $5,484 | $105,300 | $60,000 | $45,300 |
| 2022 | $5,321 | $105,300 | $60,000 | $45,300 |
| 2021 | $4,095 | $105,300 | $60,000 | $45,300 |
| 2020 | $5,353 | $105,300 | $60,000 | $45,300 |
| 2019 | $5,402 | $105,300 | $60,000 | $45,300 |
| 2018 | $5,225 | $105,300 | $60,000 | $45,300 |
| 2017 | $5,218 | $105,300 | $60,000 | $45,300 |
| 2016 | $5,163 | $105,300 | $60,000 | $45,300 |
| 2015 | $5,561 | $117,000 | $60,000 | $57,000 |
| 2014 | $5,471 | $117,000 | $60,000 | $57,000 |
Source: Public Records
Map
Nearby Homes
- 1312 Juniper Ct
- 206 Ash Ct
- 3011 Cypress Ct
- 3242 Cypress Ct Unit 3242
- 4031 Bayberry Ct
- 1111 Hickory Ct
- 1106 Hickory Ct
- 7041 Elm Ct
- 6143 Cedar Ct
- 5192 Beech Ct
- 209 Gambocz Ct
- 32 Magnolia Ct
- 30 Magnolia Ct
- 22 Witch Hazel Ct Unit 2
- 4 Donner Ct
- 6 Donner Ct
- 118 Andover Dr
- 9 Kearns Place Unit 3805
- 19 Dunwell Dr
- 586 Ridge Rd
- 1515 Mahogany Ct Unit 1515
- 1513 Mahogany Ct
- 1513 Mahogany Ct
- 1605 Mulberry Ct Unit 1605
- 1603 Mulberry Ct Unit 1603
- 1602 Mulberry Ct
- 1601 Mulberry Ct
- 1512 Mahogany Ct
- 1606 Mulberry Ct
- 1511 Mahogany Ct Unit 1511
- 1510 Mahogany Ct Unit 1510
- 1607 Mulberry Ct
- 1509 Mahogany Ct
- 1509 Mahogany Ct
- 1608 Mulberry Ct
- 1609 Mulberry Ct
- 1507 Mahogany Ct Unit 1507
- 1508 Mahogany Ct
- 1503 Mahogany Ct
- 1502 Mahogany Ct