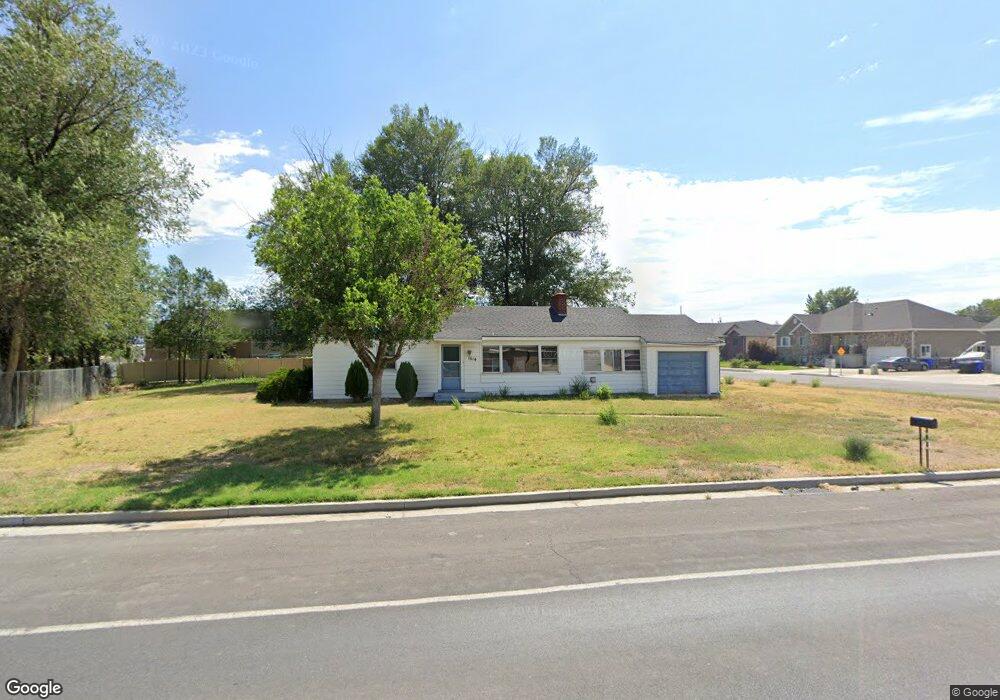
1514 N 4500 W Clearfield, UT 84015
Estimated Value: $408,855 - $489,000
3
Beds
1
Bath
1,200
Sq Ft
$367/Sq Ft
Est. Value
About This Home
This home is located at 1514 N 4500 W, Clearfield, UT 84015 and is currently estimated at $440,964, approximately $367 per square foot. 1514 N 4500 W is a home located in Davis County with nearby schools including West Point School, West Point Junior High School, and Syracuse High School.
Ownership History
Date
Name
Owned For
Owner Type
Purchase Details
Closed on
Jan 2, 2024
Sold by
Russell Keith R
Bought by
Dorius Val E
Current Estimated Value
Purchase Details
Closed on
Nov 3, 2008
Sold by
Russell Keith and Russell Keith R
Bought by
Russell Keith R
Home Financials for this Owner
Home Financials are based on the most recent Mortgage that was taken out on this home.
Original Mortgage
$99,375
Interest Rate
5.77%
Mortgage Type
Stand Alone Refi Refinance Of Original Loan
Purchase Details
Closed on
Sep 26, 2008
Sold by
Toucan Investment Real Estate & Developm
Bought by
Russell Keith
Home Financials for this Owner
Home Financials are based on the most recent Mortgage that was taken out on this home.
Original Mortgage
$99,375
Interest Rate
5.77%
Mortgage Type
Stand Alone Refi Refinance Of Original Loan
Purchase Details
Closed on
May 7, 2003
Sold by
Edwards La Vona B
Bought by
Edwards Barbara Jean and Edwards La Vona B
Create a Home Valuation Report for This Property
The Home Valuation Report is an in-depth analysis detailing your home's value as well as a comparison with similar homes in the area
Home Values in the Area
Average Home Value in this Area
Purchase History
| Date | Buyer | Sale Price | Title Company |
|---|---|---|---|
| Dorius Val E | -- | None Listed On Document | |
| Russell Keith R | -- | First American Title | |
| Russell Keith | -- | First American Title | |
| Edwards Barbara Jean | -- | -- |
Source: Public Records
Mortgage History
| Date | Status | Borrower | Loan Amount |
|---|---|---|---|
| Previous Owner | Russell Keith R | $99,375 |
Source: Public Records
Tax History Compared to Growth
Tax History
| Year | Tax Paid | Tax Assessment Tax Assessment Total Assessment is a certain percentage of the fair market value that is determined by local assessors to be the total taxable value of land and additions on the property. | Land | Improvement |
|---|---|---|---|---|
| 2025 | $1,809 | $173,250 | $114,861 | $58,389 |
| 2024 | $1,809 | $167,199 | $103,368 | $63,831 |
| 2023 | $1,671 | $156,200 | $72,209 | $83,990 |
| 2022 | $1,779 | $301,000 | $125,424 | $175,576 |
| 2021 | $1,596 | $222,000 | $105,126 | $116,874 |
| 2020 | $1,402 | $192,000 | $88,795 | $103,205 |
| 2019 | $1,363 | $184,000 | $86,005 | $97,995 |
| 2018 | $1,227 | $163,000 | $84,958 | $78,042 |
| 2016 | $997 | $69,520 | $32,918 | $36,602 |
| 2015 | $993 | $65,615 | $32,918 | $32,697 |
| 2014 | $1,085 | $72,537 | $32,918 | $39,619 |
| 2013 | -- | $59,387 | $27,596 | $31,791 |
Source: Public Records
Map
Nearby Homes
- 1635 N 4625 W
- 1717 N 4325 W
- 2084 N 4500 W
- 4061 W 1250 N Unit 1250
- 1124 N 4150 W
- 4469 W 1000 N Unit 120
- 3932 W 825 N Unit WF5
- 3918 W 825 N Unit WF6
- 4171 W 2425 N
- 4719 W 650 N
- 3784 W 2300 N
- 3762 W 2300 N
- 477 N 4500 W
- Torino Farmhouse Plan at Cranefield Estates
- 1700 Farmhouse Plan at Cranefield Estates - Estates Collection
- 2000 Traditional Plan at Cranefield Estates - Estates Collection
- Murano Traditional Plan at Cranefield Estates - Estates Collection
- 2400 Farmhouse Plan at Cranefield Estates - Estates Collection
- 1825 Traditional Plan at Cranefield Estates - Estates Collection
- 1550 Craftsman Plan at Cranefield Estates - Estates Collection