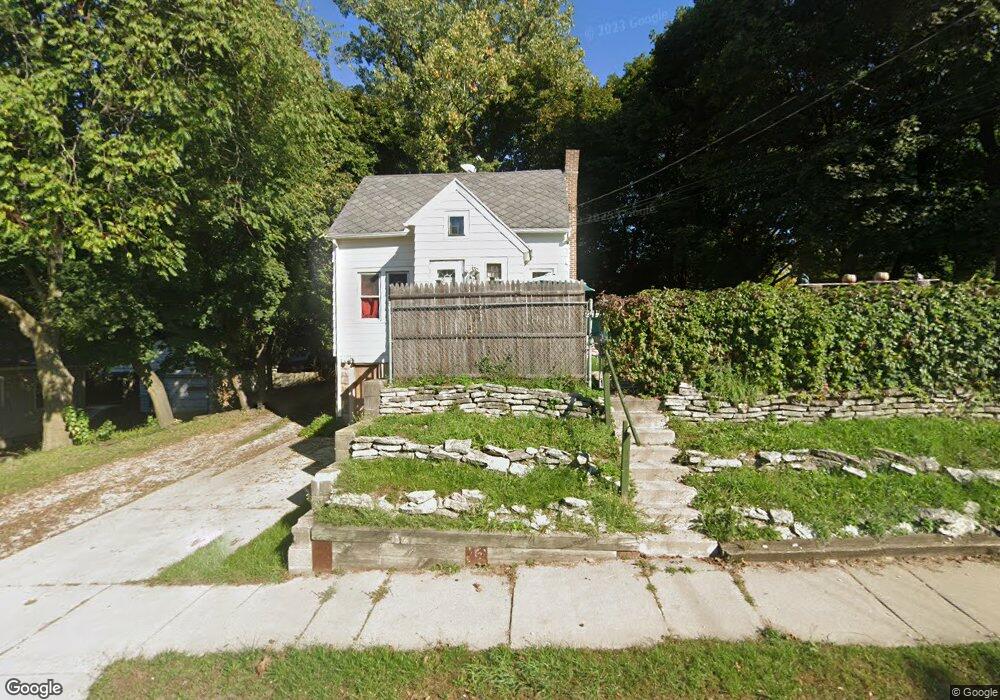
1514 N Martin Luther King jr Blvd Lansing, MI 48915
Knollwood Willow NeighborhoodEstimated Value: $82,000 - $98,000
2
Beds
1
Bath
802
Sq Ft
$113/Sq Ft
Est. Value
About This Home
This home is located at 1514 N Martin Luther King jr Blvd, Lansing, MI 48915 and is currently estimated at $90,831, approximately $113 per square foot. 1514 N Martin Luther King jr Blvd is a home located in Ingham County with nearby schools including Willow School, Pattengill Academy, and J.W. Sexton High School.
Ownership History
Date
Name
Owned For
Owner Type
Purchase Details
Closed on
Feb 18, 2010
Sold by
Cabrera Veronica and Arroyo Javier
Bought by
Us Bank National Association
Current Estimated Value
Purchase Details
Closed on
Dec 14, 2005
Sold by
Pesina Daniel and Pesina Claudia
Bought by
Cabrera Veronica and Arroyo Javier
Home Financials for this Owner
Home Financials are based on the most recent Mortgage that was taken out on this home.
Original Mortgage
$67,500
Interest Rate
8.99%
Mortgage Type
Fannie Mae Freddie Mac
Purchase Details
Closed on
Feb 12, 2000
Sold by
Moore Renee D
Bought by
Pesina Daniel
Home Financials for this Owner
Home Financials are based on the most recent Mortgage that was taken out on this home.
Original Mortgage
$12,120
Interest Rate
8.16%
Mortgage Type
Purchase Money Mortgage
Purchase Details
Closed on
Dec 1, 1993
Create a Home Valuation Report for This Property
The Home Valuation Report is an in-depth analysis detailing your home's value as well as a comparison with similar homes in the area
Home Values in the Area
Average Home Value in this Area
Purchase History
| Date | Buyer | Sale Price | Title Company |
|---|---|---|---|
| Us Bank National Association | $26,000 | None Available | |
| Cabrera Veronica | $75,000 | Bell Title Company | |
| Pesina Daniel | $18,500 | Midstate Title Company | |
| -- | $25,000 | -- |
Source: Public Records
Mortgage History
| Date | Status | Borrower | Loan Amount |
|---|---|---|---|
| Previous Owner | Cabrera Veronica | $67,500 | |
| Previous Owner | Pesina Daniel | $12,120 |
Source: Public Records
Tax History Compared to Growth
Tax History
| Year | Tax Paid | Tax Assessment Tax Assessment Total Assessment is a certain percentage of the fair market value that is determined by local assessors to be the total taxable value of land and additions on the property. | Land | Improvement |
|---|---|---|---|---|
| 2025 | $1,804 | $35,900 | $7,400 | $28,500 |
| 2024 | $14 | $35,100 | $7,400 | $27,700 |
| 2023 | $1,694 | $30,400 | $7,400 | $23,000 |
| 2022 | $1,531 | $26,600 | $7,100 | $19,500 |
| 2021 | $1,499 | $25,500 | $7,200 | $18,300 |
| 2020 | $1,490 | $23,900 | $7,200 | $16,700 |
| 2019 | $2,472 | $23,100 | $7,200 | $15,900 |
| 2018 | $1,339 | $22,400 | $7,200 | $15,200 |
| 2017 | $1,281 | $22,400 | $7,200 | $15,200 |
| 2016 | $2,196 | $22,000 | $7,200 | $14,800 |
| 2015 | $2,196 | $21,500 | $14,313 | $7,187 |
| 2014 | $2,196 | $21,000 | $15,000 | $6,000 |
Source: Public Records
Map
Nearby Homes
- 1430 N Martin Luther King jr Blvd
- 1537 Roselawn Ave
- 1616 Roseneath Ave
- 1422 Redwood St
- 1432 Redwood St
- 1320 Glenrose Ave
- 1620 Comfort St
- 1327 N Jenison Ave
- 1224 Theodore St
- 1129 N Martin Luther King jr Blvd
- 1300 W Maple St
- 1310 W Maple St
- 1019 Daleford St
- 908 Clyde St
- 406 Pleasant St
- 624 Brook St
- 1016 Cleo St
- 1840 W Maple St
- 814 N Martin Luther King jr Blvd
- 820 Princeton Ave
- 1514 N Mlk Blvd
- 1520 N Mlk Blvd
- 1040 Queen St
- 1046 Queen St
- 1034 Queen St
- 1515 Roseneath Ave
- 1511 Roseneath Ave
- 1526 N Mlk Blvd
- 1526 N Martin Luther King Junior Blvd
- 1517 N Martin Luther King jr Blvd
- 1028 Queen St
- 1511 M l King jr Blvd
- 1511 N Mlk Blvd
- 1527 Roseneath Ave
- 1517 N Mlk Blvd
- 1509 N Mlk Blvd
- 1517 N Martin Luther King
- 1517 N Martin Luther