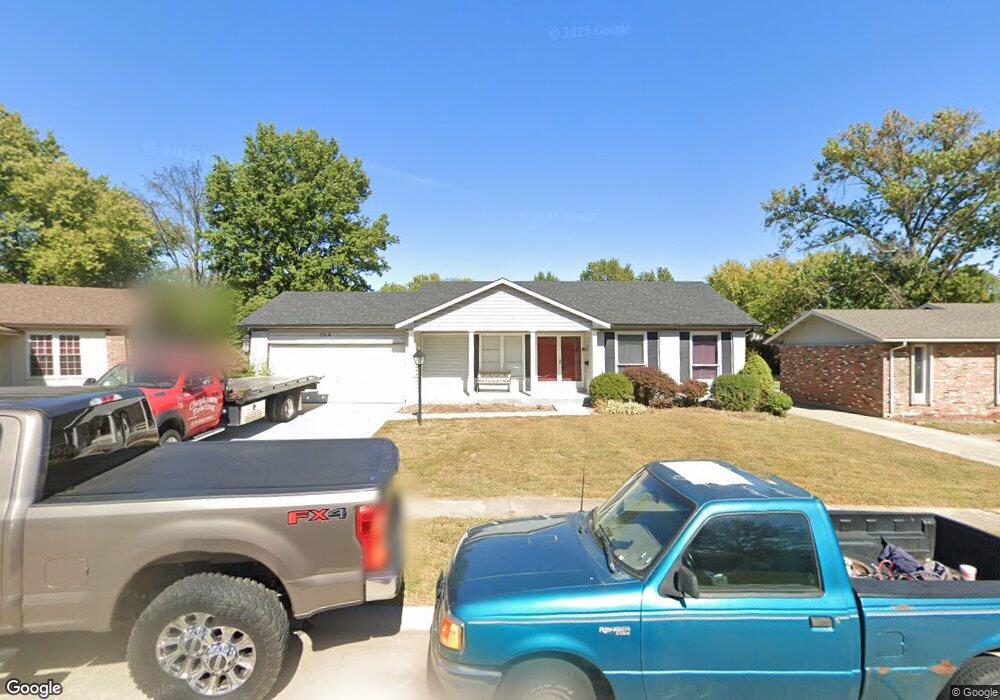
1514 Sycamore Glen Ct Florissant, MO 63031
Estimated Value: $227,396 - $256,000
3
Beds
2
Baths
1,741
Sq Ft
$139/Sq Ft
Est. Value
About This Home
This home is located at 1514 Sycamore Glen Ct, Florissant, MO 63031 and is currently estimated at $242,849, approximately $139 per square foot. 1514 Sycamore Glen Ct is a home located in St. Louis County with nearby schools including North Middle School, Hazelwood Central High School, and St Norbert School.
Ownership History
Date
Name
Owned For
Owner Type
Purchase Details
Closed on
Oct 31, 2017
Sold by
Clopton Allen and Clopton Allen T
Bought by
Clopton Allen T
Current Estimated Value
Home Financials for this Owner
Home Financials are based on the most recent Mortgage that was taken out on this home.
Original Mortgage
$104,800
Outstanding Balance
$57,551
Interest Rate
3.83%
Mortgage Type
New Conventional
Estimated Equity
$185,298
Purchase Details
Closed on
Oct 23, 2004
Sold by
Townson Denise
Bought by
Clopton Allen
Purchase Details
Closed on
Sep 20, 2001
Sold by
Usa Properties Llc
Bought by
Clopton Annie B
Home Financials for this Owner
Home Financials are based on the most recent Mortgage that was taken out on this home.
Original Mortgage
$115,425
Interest Rate
6.88%
Purchase Details
Closed on
Jan 25, 2001
Sold by
Hux William C and Hux Janice R
Bought by
Usa Properties Llc
Create a Home Valuation Report for This Property
The Home Valuation Report is an in-depth analysis detailing your home's value as well as a comparison with similar homes in the area
Home Values in the Area
Average Home Value in this Area
Purchase History
| Date | Buyer | Sale Price | Title Company |
|---|---|---|---|
| Clopton Allen T | -- | Copper Title Llc | |
| Clopton Allen | -- | -- | |
| Clopton Annie B | $124,900 | -- | |
| Usa Properties Llc | $90,000 | -- |
Source: Public Records
Mortgage History
| Date | Status | Borrower | Loan Amount |
|---|---|---|---|
| Open | Clopton Allen T | $104,800 | |
| Closed | Clopton Annie B | $115,425 |
Source: Public Records
Tax History Compared to Growth
Tax History
| Year | Tax Paid | Tax Assessment Tax Assessment Total Assessment is a certain percentage of the fair market value that is determined by local assessors to be the total taxable value of land and additions on the property. | Land | Improvement |
|---|---|---|---|---|
| 2025 | $3,163 | $39,270 | $6,570 | $32,700 |
| 2024 | $3,163 | $36,250 | $2,620 | $33,630 |
| 2023 | $3,159 | $36,250 | $2,620 | $33,630 |
| 2022 | $2,718 | $27,760 | $4,290 | $23,470 |
| 2021 | $2,679 | $27,760 | $4,290 | $23,470 |
| 2020 | $2,498 | $24,090 | $6,570 | $17,520 |
| 2019 | $2,461 | $24,090 | $6,570 | $17,520 |
| 2018 | $2,354 | $21,190 | $2,110 | $19,080 |
| 2017 | $2,351 | $21,190 | $2,110 | $19,080 |
| 2016 | $2,410 | $21,430 | $2,490 | $18,940 |
| 2015 | $2,358 | $21,430 | $2,490 | $18,940 |
| 2014 | $2,260 | $21,150 | $4,140 | $17,010 |
Source: Public Records
Map
Nearby Homes
- 1455 Burnside Ct
- 1638 Matlock Dr
- 3660 Woodman Dr
- 3645 Woodman Dr
- 1323 Woodpath Dr
- 1807 Kilmory Dr
- 1522 Sherwood Forest Dr
- 1641 Sherwood Forest Dr
- 2 Aspen II at Riverstone
- 3849 Secretariat Dr
- 16787 River Stone Dr
- 3035 Matlock Dr
- 2 Ashford at Riverstone
- 3213 Yvette Ct
- 2 Berwick at Riverstone
- 2 Maple at Riverstone
- 16804 River Stone Dr
- 3828 Sonora Stone Dr
- 1303 Topsider Ct
- 3844 Rapids Dr
- 1504 Sycamore Glen Ct
- 1524 Sycamore Glen Ct
- 1511 Barkwood Dr
- 1501 Barkwood Dr
- 1531 Barkwood Dr
- 1523 Sycamore Glen Ct
- 1534 Sycamore Glen Ct
- 3529 Whispering Woods Dr
- 1551 Barkwood Dr
- 1544 Sycamore Glen Ct
- 1553 Sycamore Glen Ct
- 3489 Whispering Woods Dr
- 1554 Sycamore Glen Ct
- 3558 Whispering Woods Dr
- 3578 Whispering Woods Dr
- 1512 Barkwood Dr
- 3538 Whispering Woods Dr
- 1502 Barkwood Dr
- 1532 Barkwood Dr
- 3598 Whispering Woods Dr