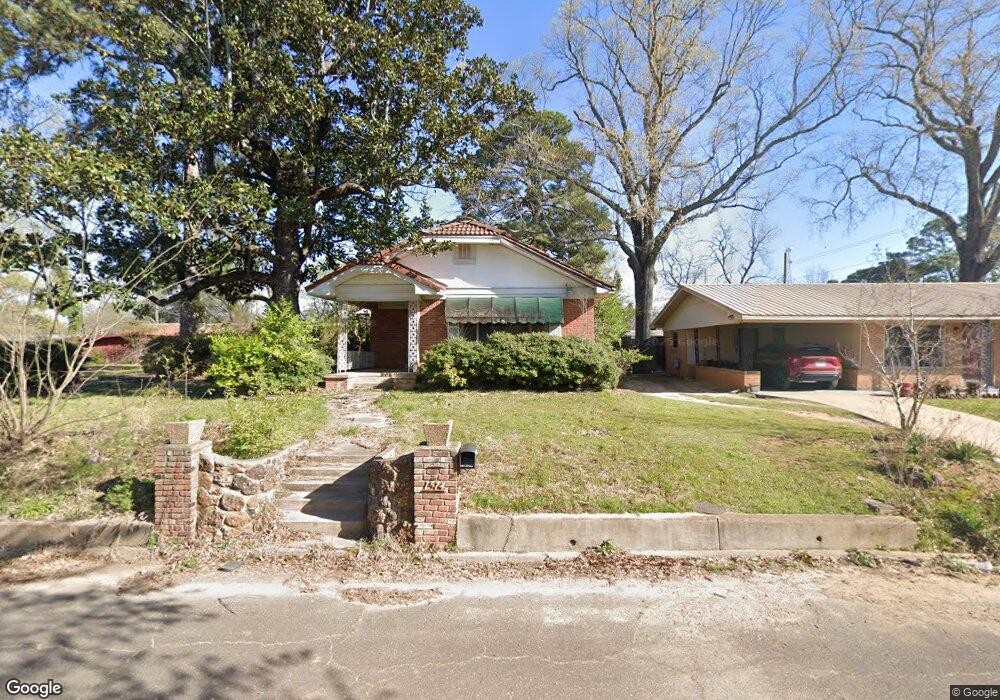
1514 W 11th St Texarkana, TX 75501
Estimated Value: $65,000 - $102,000
--
Bed
--
Bath
1,619
Sq Ft
$49/Sq Ft
Est. Value
About This Home
This home is located at 1514 W 11th St, Texarkana, TX 75501 and is currently estimated at $80,046, approximately $49 per square foot. 1514 W 11th St is a home located in Bowie County with nearby schools including Theron Jones Early Literacy Center, Westlawn Elementary School, and Texas Middle School.
Ownership History
Date
Name
Owned For
Owner Type
Purchase Details
Closed on
Jun 10, 2016
Sold by
Elmore Joe D and Elmore Gloria W
Bought by
Hastings Kenneth Norris
Current Estimated Value
Home Financials for this Owner
Home Financials are based on the most recent Mortgage that was taken out on this home.
Original Mortgage
$26,400
Outstanding Balance
$20,982
Interest Rate
3.61%
Mortgage Type
Purchase Money Mortgage
Estimated Equity
$59,064
Purchase Details
Closed on
Jan 5, 2016
Sold by
Carroll John Paul
Bought by
Elmore Joe D and Elmore Gloria W
Purchase Details
Closed on
Dec 4, 2012
Sold by
Carroll James E and Carroll Fredia Elizabeth
Bought by
Llybf Properties Llc
Purchase Details
Closed on
Feb 29, 2012
Sold by
Carroll Christopher and Carroll Terre
Bought by
Carroll John Paul
Create a Home Valuation Report for This Property
The Home Valuation Report is an in-depth analysis detailing your home's value as well as a comparison with similar homes in the area
Home Values in the Area
Average Home Value in this Area
Purchase History
| Date | Buyer | Sale Price | Title Company |
|---|---|---|---|
| Hastings Kenneth Norris | -- | Twin City Title Company | |
| Elmore Joe D | $23,000 | Twin City Title Company | |
| Llybf Properties Llc | $13,000 | None Available | |
| Carroll John Paul | -- | None Available |
Source: Public Records
Mortgage History
| Date | Status | Borrower | Loan Amount |
|---|---|---|---|
| Open | Hastings Kenneth Norris | $26,400 |
Source: Public Records
Tax History Compared to Growth
Tax History
| Year | Tax Paid | Tax Assessment Tax Assessment Total Assessment is a certain percentage of the fair market value that is determined by local assessors to be the total taxable value of land and additions on the property. | Land | Improvement |
|---|---|---|---|---|
| 2025 | $1,300 | $56,324 | $3,000 | $53,324 |
| 2024 | $1,300 | $54,893 | $3,000 | $51,893 |
| 2023 | $1,364 | $57,616 | $2,700 | $54,916 |
| 2022 | $1,247 | $52,254 | $2,700 | $49,554 |
| 2021 | $1,276 | $49,916 | $2,700 | $47,216 |
| 2020 | $1,140 | $44,344 | $2,700 | $41,644 |
| 2019 | $1,329 | $49,820 | $2,700 | $47,120 |
| 2018 | $1,296 | $48,585 | $2,700 | $45,885 |
| 2017 | $1,271 | $47,786 | $2,700 | $45,086 |
| 2016 | $1,271 | $47,786 | $2,700 | $45,086 |
| 2015 | $1,309 | $47,786 | $2,700 | $45,086 |
| 2014 | $1,309 | $50,605 | $2,700 | $47,905 |
Source: Public Records
Map
Nearby Homes