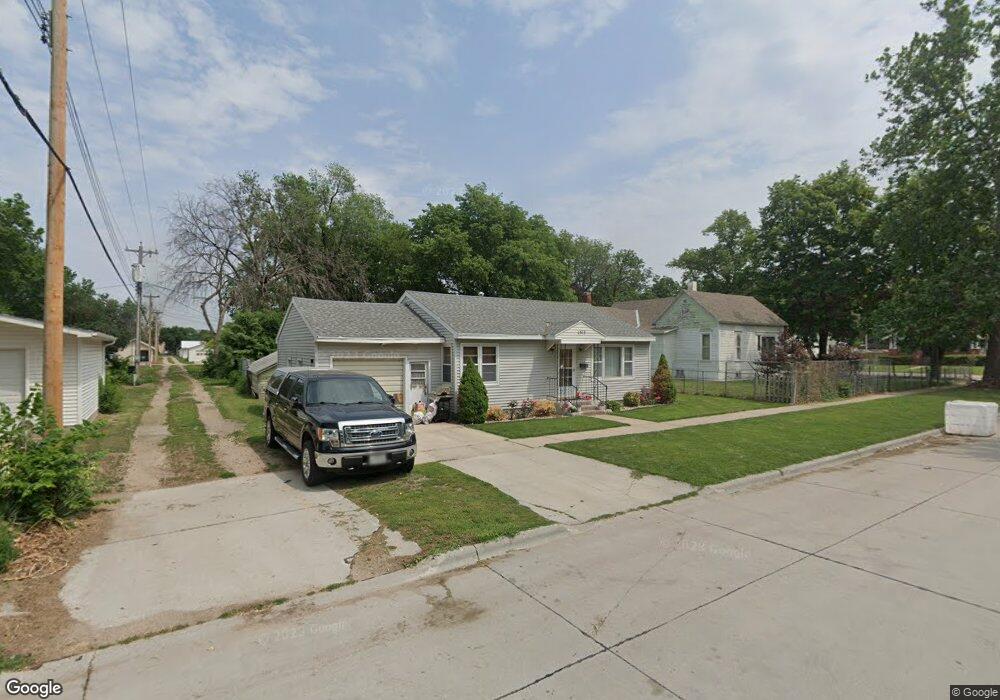
1515 12th Ave Central City, NE 68826
Estimated Value: $99,000 - $164,000
2
Beds
1
Bath
858
Sq Ft
$144/Sq Ft
Est. Value
About This Home
This home is located at 1515 12th Ave, Central City, NE 68826 and is currently estimated at $123,667, approximately $144 per square foot. 1515 12th Ave is a home located in Merrick County with nearby schools including Central City Elementary School, Central City Middle School, and Central City High School.
Ownership History
Date
Name
Owned For
Owner Type
Purchase Details
Closed on
Jun 26, 2025
Sold by
Shelton Max H
Bought by
Syenergyinvest Inc
Current Estimated Value
Home Financials for this Owner
Home Financials are based on the most recent Mortgage that was taken out on this home.
Original Mortgage
$102,000
Outstanding Balance
$101,295
Interest Rate
5.97%
Mortgage Type
New Conventional
Estimated Equity
$22,372
Purchase Details
Closed on
Jun 25, 2025
Sold by
Forbis David M and Forbis Shirley M
Bought by
Syenergyinvest Inc
Home Financials for this Owner
Home Financials are based on the most recent Mortgage that was taken out on this home.
Original Mortgage
$102,000
Outstanding Balance
$101,295
Interest Rate
5.97%
Mortgage Type
New Conventional
Estimated Equity
$22,372
Purchase Details
Closed on
Aug 23, 2024
Sold by
Hanke Dean C
Bought by
Forbis Shirley M
Create a Home Valuation Report for This Property
The Home Valuation Report is an in-depth analysis detailing your home's value as well as a comparison with similar homes in the area
Home Values in the Area
Average Home Value in this Area
Purchase History
| Date | Buyer | Sale Price | Title Company |
|---|---|---|---|
| Syenergyinvest Inc | -- | None Listed On Document | |
| Syenergyinvest Inc | $128,000 | None Listed On Document | |
| Forbis Shirley M | $1,000 | None Listed On Document |
Source: Public Records
Mortgage History
| Date | Status | Borrower | Loan Amount |
|---|---|---|---|
| Open | Syenergyinvest Inc | $102,000 | |
| Closed | Syenergyinvest Inc | $102,000 |
Source: Public Records
Tax History Compared to Growth
Tax History
| Year | Tax Paid | Tax Assessment Tax Assessment Total Assessment is a certain percentage of the fair market value that is determined by local assessors to be the total taxable value of land and additions on the property. | Land | Improvement |
|---|---|---|---|---|
| 2025 | $766 | $67,925 | $6,590 | $61,335 |
| 2024 | $766 | $67,630 | $6,295 | $61,335 |
| 2023 | $934 | $64,555 | $3,220 | $61,335 |
| 2022 | $1,061 | $64,555 | $3,220 | $61,335 |
| 2021 | $1,035 | $59,790 | $3,220 | $56,570 |
| 2020 | $998 | $57,615 | $3,220 | $54,395 |
| 2019 | $1,006 | $58,665 | $4,270 | $54,395 |
| 2018 | $1,010 | $58,665 | $4,270 | $54,395 |
| 2017 | $1,015 | $58,665 | $4,270 | $54,395 |
| 2016 | $741 | $42,665 | $4,270 | $38,395 |
| 2015 | $80 | $42,665 | $4,270 | $38,395 |
| 2014 | $828 | $42,665 | $4,270 | $38,395 |
| 2012 | $432 | $41,175 | $4,270 | $36,905 |
Source: Public Records
Map
Nearby Homes