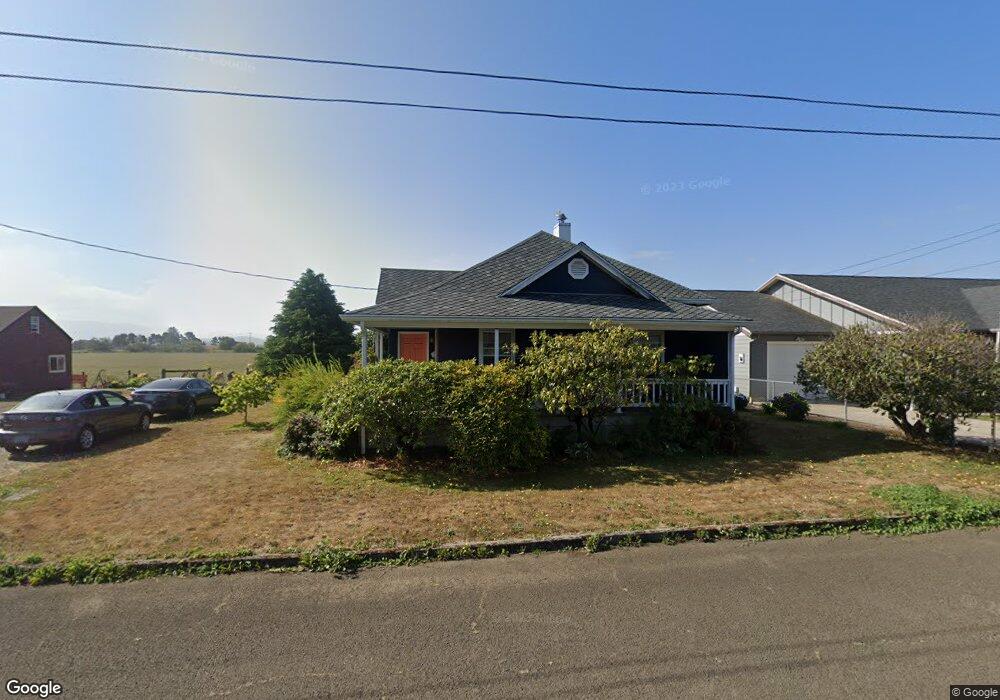
1515 12th St Tillamook, OR 97141
Estimated Value: $328,000 - $350,397
3
Beds
1
Bath
1,282
Sq Ft
$267/Sq Ft
Est. Value
About This Home
This home is located at 1515 12th St, Tillamook, OR 97141 and is currently estimated at $342,849, approximately $267 per square foot. 1515 12th St is a home located in Tillamook County with nearby schools including Tillamook High School, Little Clipper Preschool, and Tillamook Adventist School.
Ownership History
Date
Name
Owned For
Owner Type
Purchase Details
Closed on
Sep 15, 2008
Sold by
Wallner Wayne G and Wallner Oma L
Bought by
Kralik Luke M and Kralik Sofia J
Current Estimated Value
Home Financials for this Owner
Home Financials are based on the most recent Mortgage that was taken out on this home.
Original Mortgage
$174,656
Outstanding Balance
$116,059
Interest Rate
6.5%
Mortgage Type
Purchase Money Mortgage
Estimated Equity
$226,790
Purchase Details
Closed on
Apr 5, 2007
Sold by
State Of Oregon
Bought by
Wallner Wayne G and Wallner Oma L
Create a Home Valuation Report for This Property
The Home Valuation Report is an in-depth analysis detailing your home's value as well as a comparison with similar homes in the area
Home Values in the Area
Average Home Value in this Area
Purchase History
| Date | Buyer | Sale Price | Title Company |
|---|---|---|---|
| Kralik Luke M | $180,000 | First American | |
| Wallner Wayne G | -- | First American Title |
Source: Public Records
Mortgage History
| Date | Status | Borrower | Loan Amount |
|---|---|---|---|
| Open | Kralik Luke M | $174,656 |
Source: Public Records
Tax History Compared to Growth
Tax History
| Year | Tax Paid | Tax Assessment Tax Assessment Total Assessment is a certain percentage of the fair market value that is determined by local assessors to be the total taxable value of land and additions on the property. | Land | Improvement |
|---|---|---|---|---|
| 2024 | $1,662 | $140,830 | $45,310 | $95,520 |
| 2023 | $1,646 | $136,730 | $43,990 | $92,740 |
| 2022 | $1,590 | $132,750 | $42,710 | $90,040 |
| 2021 | $1,543 | $128,890 | $41,470 | $87,420 |
| 2020 | $1,501 | $125,140 | $40,260 | $84,880 |
| 2019 | $1,463 | $121,500 | $39,090 | $82,410 |
| 2018 | $1,425 | $117,970 | $37,950 | $80,020 |
| 2017 | $1,389 | $114,540 | $36,840 | $77,700 |
| 2016 | $1,337 | $111,210 | $35,770 | $75,440 |
| 2015 | $1,310 | $107,980 | $34,730 | $73,250 |
| 2014 | $1,289 | $104,840 | $33,720 | $71,120 |
| 2013 | -- | $101,790 | $32,740 | $69,050 |
Source: Public Records
Map
Nearby Homes