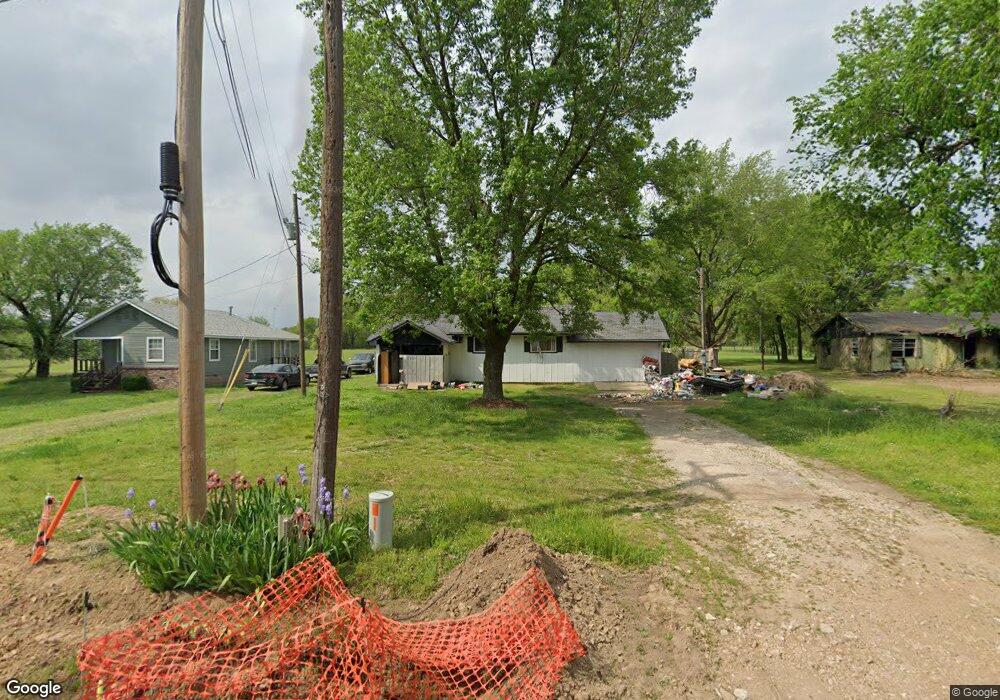
1515 E Allen Rd Tahlequah, OK 74464
Estimated Value: $109,183 - $148,000
3
Beds
1
Bath
1,080
Sq Ft
$125/Sq Ft
Est. Value
About This Home
This home is located at 1515 E Allen Rd, Tahlequah, OK 74464 and is currently estimated at $135,296, approximately $125 per square foot. 1515 E Allen Rd is a home located in Cherokee County with nearby schools including Cherokee Elementary School, Greenwood Elementary School, and Tahlequah Middle School.
Ownership History
Date
Name
Owned For
Owner Type
Purchase Details
Closed on
Apr 24, 2024
Sold by
Watson Marie
Bought by
Watson Linda
Current Estimated Value
Purchase Details
Closed on
Jan 25, 2012
Sold by
Hutchins Russell D and Hutchins Carolyn Sue
Bought by
Watson Marie
Purchase Details
Closed on
Aug 1, 2008
Sold by
Bishop Earle
Bought by
Hutchins Russell and Hutchins Carolyn
Purchase Details
Closed on
Apr 24, 2008
Sold by
Bullock Barbara
Bought by
Bishop Earle and Bullock Barbara
Purchase Details
Closed on
Oct 2, 2007
Sold by
Dunavin George Thomas and Doe Jane
Bought by
Deutsche Bank National Trust Company and Long Beach Mortgage Loan Trust 2006-Wl3
Purchase Details
Closed on
Aug 23, 2005
Sold by
Dunavin Connie Marie
Bought by
Dunavin George Thomas
Home Financials for this Owner
Home Financials are based on the most recent Mortgage that was taken out on this home.
Original Mortgage
$60,000
Interest Rate
5.65%
Mortgage Type
Assumption
Create a Home Valuation Report for This Property
The Home Valuation Report is an in-depth analysis detailing your home's value as well as a comparison with similar homes in the area
Home Values in the Area
Average Home Value in this Area
Purchase History
| Date | Buyer | Sale Price | Title Company |
|---|---|---|---|
| Watson Linda | -- | None Listed On Document | |
| Watson Marie | $53,500 | None Available | |
| Hutchins Russell | $66,000 | Tahlequah Abstract Closing S | |
| Bishop Earle | -- | Cherokee Capitol Closing | |
| Deutsche Bank National Trust Company | $59,873 | None Available | |
| Dunavin George Thomas | -- | None Available |
Source: Public Records
Mortgage History
| Date | Status | Borrower | Loan Amount |
|---|---|---|---|
| Previous Owner | Dunavin George Thomas | $60,000 |
Source: Public Records
Tax History Compared to Growth
Tax History
| Year | Tax Paid | Tax Assessment Tax Assessment Total Assessment is a certain percentage of the fair market value that is determined by local assessors to be the total taxable value of land and additions on the property. | Land | Improvement |
|---|---|---|---|---|
| 2025 | $487 | $4,952 | $193 | $4,759 |
| 2024 | $487 | $5,142 | $193 | $4,949 |
| 2023 | $487 | $5,764 | $325 | $5,439 |
| 2022 | $535 | $5,764 | $325 | $5,439 |
| 2021 | $537 | $5,764 | $325 | $5,439 |
| 2020 | $546 | $5,764 | $325 | $5,439 |
| 2019 | $542 | $5,764 | $325 | $5,439 |
| 2018 | $564 | $5,934 | $325 | $5,609 |
| 2017 | $563 | $5,934 | $325 | $5,609 |
| 2016 | $615 | $6,441 | $832 | $5,609 |
| 2015 | $554 | $6,180 | $832 | $5,348 |
| 2014 | $554 | $5,886 | $832 | $5,054 |
Source: Public Records
Map
Nearby Homes
- 1518 E Hogner St
- 1390 N Legion Dr
- 1505 E Summerfield St
- 1450 E Allen Rd
- 20596 E Whipperwill Rd
- 20413 E Allen Rd
- 920 Francis Ave
- 17730 S Old Highway 62
- 802 E Seneca St
- 407 N Bliss Ave
- 2205 Oakridge Dr
- 2000 Tarkington St
- 425 E Seneca St
- 510 Talley St
- 707 Victor St
- 503 Kim St
- 0 Hwy 10 N Unit 2514793
- 710 Victor St
- 403 Kim St
- 305 Wheeler St
- 1512 E Allen Rd
- 1519 E Allen Rd
- 1514 E Allen Rd
- 1516 E Allen Rd
- 1510 E Allen Rd
- 1603 E Allen Rd
- 1513 E Hogner St
- 1511 E Hogner St
- 1515 E Hogner St
- 1504 E Allen Rd
- 1506 E Allen Rd
- 1509 E Hogner St
- 17020 Brooklynn Ave
- 1234 N Legion Dr
- 1507 E Hogner St
- 17044 Brooklynn Ave
- 1228 N Legion Dr
- 1607 E Allen Rd
- 1514 E Hogner St
- 1516 E Hogner St