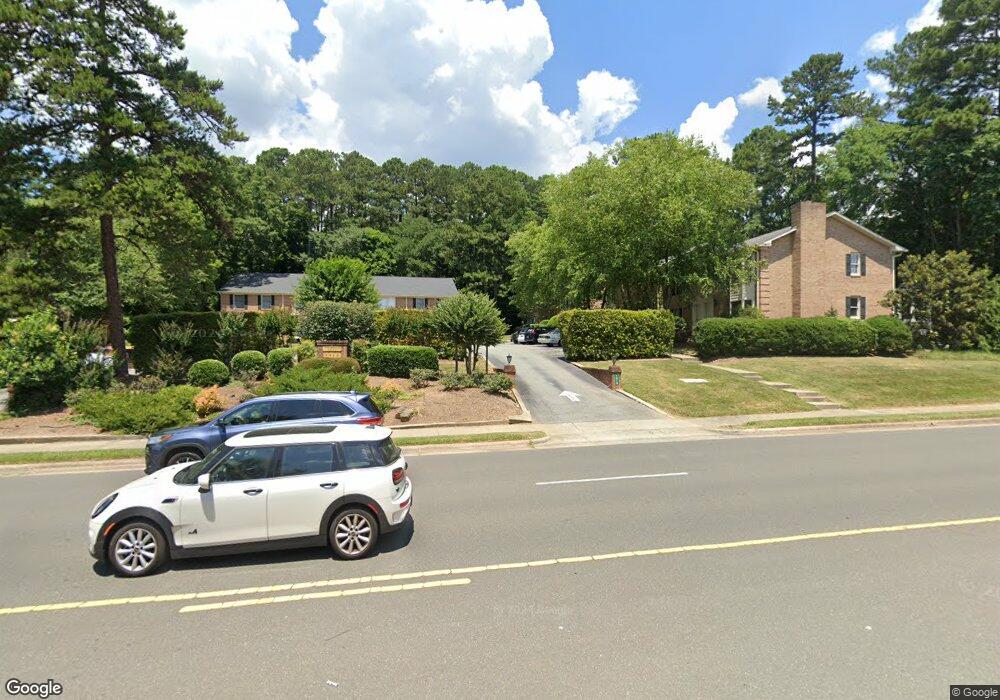
1515 E Franklin St Unit 14 Chapel Hill, NC 27514
Estimated Value: $249,000 - $333,000
2
Beds
2
Baths
1,073
Sq Ft
$272/Sq Ft
Est. Value
About This Home
This home is located at 1515 E Franklin St Unit 14, Chapel Hill, NC 27514 and is currently estimated at $291,340, approximately $271 per square foot. 1515 E Franklin St Unit 14 is a home located in Orange County with nearby schools including Estes Hills Elementary School, Phillips Middle School, and East Chapel Hill High School.
Ownership History
Date
Name
Owned For
Owner Type
Purchase Details
Closed on
Oct 3, 2012
Sold by
Baxter Imogen J and Baxter Lawrence G
Bought by
Veologica Llc
Current Estimated Value
Purchase Details
Closed on
Jan 11, 2008
Sold by
Ventre Robert M and Ventre Frances K
Bought by
Baxter Imogen J and Baxter Lawrence G
Purchase Details
Closed on
Apr 27, 2006
Sold by
Basnight Dorothy H
Bought by
Ventre Robert M and Ventre Frances K
Purchase Details
Closed on
Dec 22, 2003
Sold by
Council Sally C
Bought by
Basnight Dorothy H
Purchase Details
Closed on
Feb 27, 2003
Sold by
Lambert Michael C and Lambert Denni J H
Bought by
Council Sally C
Home Financials for this Owner
Home Financials are based on the most recent Mortgage that was taken out on this home.
Original Mortgage
$108,000
Interest Rate
5.95%
Mortgage Type
Purchase Money Mortgage
Create a Home Valuation Report for This Property
The Home Valuation Report is an in-depth analysis detailing your home's value as well as a comparison with similar homes in the area
Home Values in the Area
Average Home Value in this Area
Purchase History
| Date | Buyer | Sale Price | Title Company |
|---|---|---|---|
| Veologica Llc | $172,000 | None Available | |
| Baxter Imogen J | $182,000 | None Available | |
| Ventre Robert M | $200,000 | None Available | |
| Basnight Dorothy H | $155,000 | -- | |
| Council Sally C | $135,000 | -- |
Source: Public Records
Mortgage History
| Date | Status | Borrower | Loan Amount |
|---|---|---|---|
| Previous Owner | Council Sally C | $108,000 |
Source: Public Records
Tax History Compared to Growth
Tax History
| Year | Tax Paid | Tax Assessment Tax Assessment Total Assessment is a certain percentage of the fair market value that is determined by local assessors to be the total taxable value of land and additions on the property. | Land | Improvement |
|---|---|---|---|---|
| 2025 | $3,795 | $280,000 | $0 | $280,000 |
| 2024 | $3,341 | $190,900 | $0 | $190,900 |
| 2023 | $3,255 | $190,900 | $0 | $190,900 |
| 2022 | $3,123 | $190,900 | $0 | $190,900 |
| 2021 | $3,084 | $190,900 | $0 | $190,900 |
| 2020 | $2,953 | $171,200 | $0 | $171,200 |
| 2018 | $2,882 | $171,200 | $0 | $171,200 |
| 2017 | $2,770 | $171,200 | $0 | $171,200 |
| 2016 | $2,770 | $163,146 | $38,599 | $124,547 |
| 2015 | $2,770 | $163,146 | $38,599 | $124,547 |
| 2014 | $2,712 | $163,146 | $38,599 | $124,547 |
Source: Public Records
Map
Nearby Homes
- 1513 E Franklin St Unit Bldg A 104
- 115 N Estes Dr
- 305 N Elliott Rd
- 112 Meadowbrook Dr
- 1002 Willow Dr Unit 24
- 1002 Willow Dr Unit 17
- 1002 Willow Dr Unit 107
- 1002 Willow Dr Unit 37
- 100 Eastwood Lake Rd
- 123 Weavers Grove Dr
- 130 S Estes Dr Unit G5
- 0 Burlage Cir
- 409 Granville Rd
- 1 Shepherd Ln Unit B4
- 1407 E Franklin St
- 250 S Estes Dr Unit 31
- 250 S Estes Dr Unit 11A
- 250 S Estes Dr Unit 115
- 250 S Estes Dr Unit 101
- 412 N Elliott Rd
- 1515 E Franklin St Unit 12
- 1515 E Franklin St Unit 17
- 1515 E Franklin St Unit 32
- 1515 E Franklin St Unit 25
- 1515 E Franklin St Unit 26
- 1515 E Franklin St Unit 15
- 1515 E Franklin St Unit 13
- 1515 E Franklin St Unit 35
- 1515 E Franklin St Unit 41
- 1515 E Franklin St Unit D2
- 1515 E Franklin St Unit 24
- 1515 E Franklin St Unit 21E
- 1515 E Franklin St Unit 27
- 1515 E Franklin St Unit 33
- 1515 E Franklin St Unit 11
- 1515 E Franklin St
- 1515 E Franklin St Unit 22
- 1515 E Franklin St Unit 23
- 1515 E Franklin St Unit 43
- 1515 E Franklin St Unit 31