1515 E Richland Dr Bloomington, IN 47408
Estimated Value: $456,000 - $535,002
3
Beds
3
Baths
3,289
Sq Ft
$153/Sq Ft
Est. Value
About This Home
This home is located at 1515 E Richland Dr, Bloomington, IN 47408 and is currently estimated at $503,334, approximately $153 per square foot. 1515 E Richland Dr is a home located in Monroe County with nearby schools including Marlin Elementary School, Tri-North Middle School, and Bloomington High School North.
Ownership History
Date
Name
Owned For
Owner Type
Purchase Details
Closed on
Dec 16, 2013
Sold by
Levitt Faith M
Bought by
Levitt Russell D
Current Estimated Value
Purchase Details
Closed on
Nov 20, 2009
Sold by
Vasilopoulos Bill
Bought by
Levitt Russell D and Levitt Faith M
Home Financials for this Owner
Home Financials are based on the most recent Mortgage that was taken out on this home.
Original Mortgage
$168,000
Outstanding Balance
$108,077
Interest Rate
5.11%
Mortgage Type
New Conventional
Estimated Equity
$395,257
Purchase Details
Closed on
Sep 25, 2006
Sold by
First Franklin Financial Corp
Bought by
Vasilopoulos Bill
Home Financials for this Owner
Home Financials are based on the most recent Mortgage that was taken out on this home.
Original Mortgage
$166,500
Interest Rate
6.49%
Mortgage Type
New Conventional
Purchase Details
Closed on
Jul 21, 2006
Sold by
Schulz Shannon and Schulz William Hubert
Bought by
First Franklin Financial Corp
Create a Home Valuation Report for This Property
The Home Valuation Report is an in-depth analysis detailing your home's value as well as a comparison with similar homes in the area
Purchase History
| Date | Buyer | Sale Price | Title Company |
|---|---|---|---|
| Levitt Russell D | -- | None Available | |
| Levitt Russell D | -- | Legacy Title & Escrow Servic | |
| Vasilopoulos Bill | -- | Towne & Coutry Land Title Ag | |
| First Franklin Financial Corp | -- | None Available |
Source: Public Records
Mortgage History
| Date | Status | Borrower | Loan Amount |
|---|---|---|---|
| Open | Levitt Russell D | $168,000 | |
| Previous Owner | Vasilopoulos Bill | $166,500 |
Source: Public Records
Tax History
| Year | Tax Paid | Tax Assessment Tax Assessment Total Assessment is a certain percentage of the fair market value that is determined by local assessors to be the total taxable value of land and additions on the property. | Land | Improvement |
|---|---|---|---|---|
| 2025 | $2,650 | $348,800 | $50,200 | $298,600 |
| 2024 | $2,650 | $341,400 | $41,800 | $299,600 |
| 2023 | $2,716 | $333,500 | $40,200 | $293,300 |
| 2022 | $2,562 | $312,800 | $40,100 | $272,700 |
| 2021 | $2,510 | $297,300 | $30,100 | $267,200 |
| 2020 | $2,529 | $288,600 | $30,100 | $258,500 |
| 2019 | $2,494 | $287,800 | $46,800 | $241,000 |
| 2018 | $2,612 | $290,000 | $46,800 | $243,200 |
| 2017 | $2,603 | $287,700 | $46,800 | $240,900 |
| 2016 | $2,948 | $283,700 | $46,800 | $236,900 |
| 2014 | $2,316 | $284,100 | $46,800 | $237,300 |
Source: Public Records
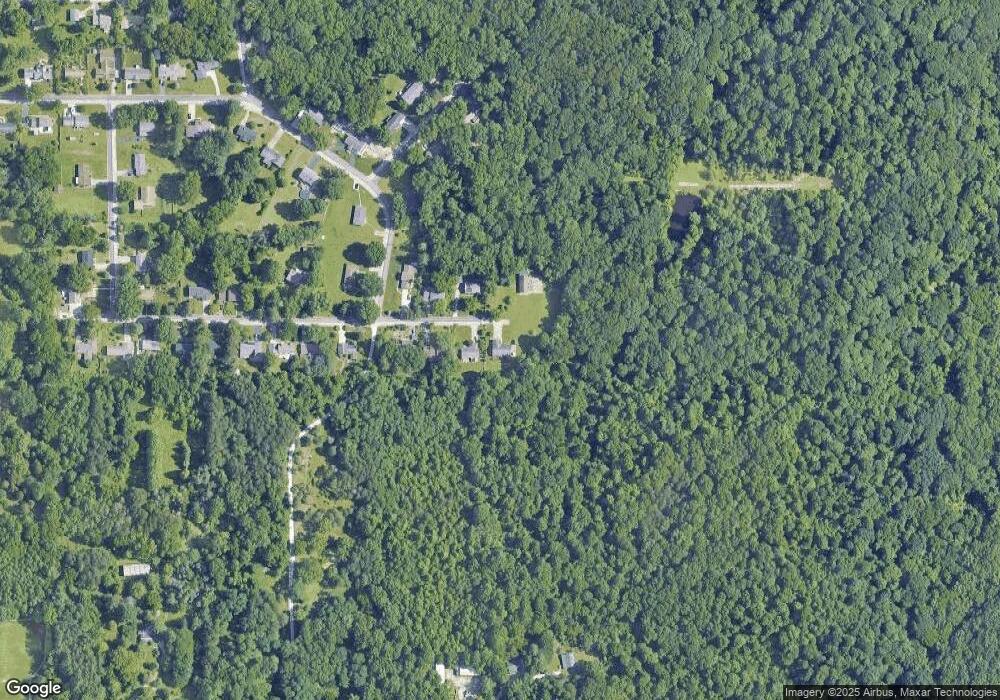
Map
Nearby Homes
- 1605 E Woodland Dr
- 1400 E Whisnand Rd
- 609 E Audubon Dr
- 3334 E Bethel Ln
- 409 E Woodridge Dr
- 1888 E Mel Currie Rd
- 4255 N Baugh Rd
- 4010 E Old Meyers Rd
- 410 E Blue Ridge Dr
- 4385 E Bethel Ln
- 3177 N Russell Rd
- 2906 N Ramble Rd W
- 2919 N Ramble Rd W
- 3440 N Russell Rd
- 3801 N Bittersweet Dr
- 401 E Glendora Dr
- 4224 N Rosewood Dr
- 301 E Glendora Dr
- 2401 N Dunn St
- 3912 N Whitewood Way
- 1515 E Richland Dr
- 1510 E Richland Dr
- 1509 E Richland Dr
- 1506 E Richland Dr
- 1505 E Richland Dr
- 1500 E Richland Dr
- 1611 E Fairwood Dr
- 1511 E Richland Dr
- 1414 E Richland Dr
- 1603 E Fairwood Dr
- 1516 E Fairwood Dr
- 1402 E Richland Dr
- 1512 E Fairwood Dr
- 1604 E Woodland Dr
- 1407 E Richland Dr
- 1360 E Richland Dr
- 1608 E Woodland Dr
- 1316 E Richland Dr
- 1508 E Fairwood Dr
- 1511 E Fairwood Dr
Your Personal Tour Guide
Ask me questions while you tour the home.