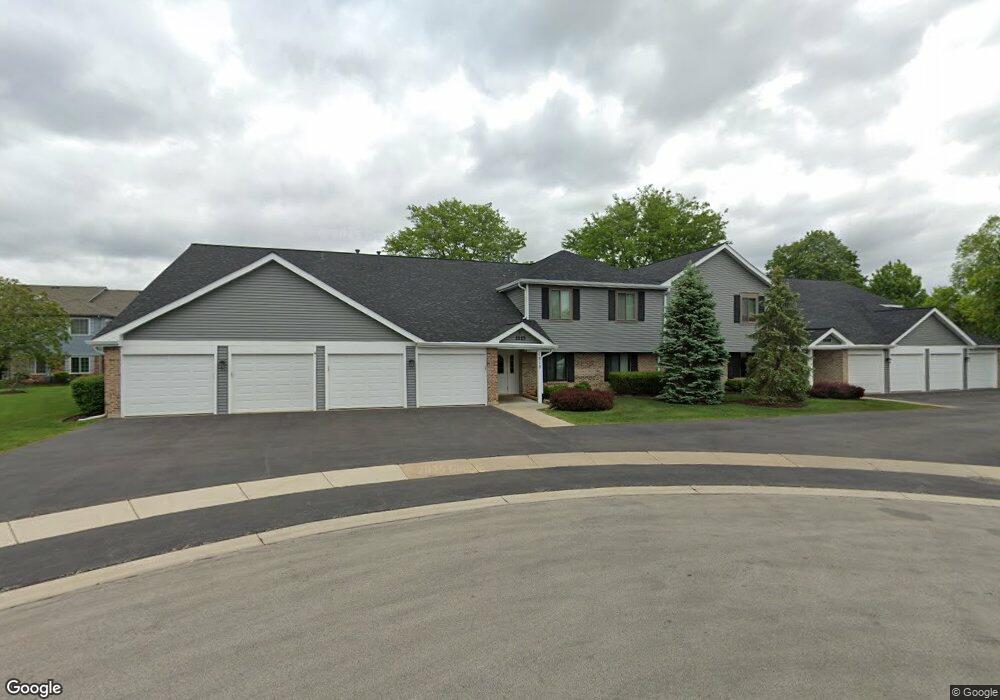
1515 Harbour Ct Unit 32BL Schaumburg, IL 60193
South Schaumburg NeighborhoodEstimated Value: $290,000 - $312,000
3
Beds
--
Bath
1,600
Sq Ft
$187/Sq Ft
Est. Value
About This Home
This home is located at 1515 Harbour Ct Unit 32BL, Schaumburg, IL 60193 and is currently estimated at $299,041, approximately $186 per square foot. 1515 Harbour Ct Unit 32BL is a home located in Cook County with nearby schools including Hanover Highlands Elementary School, Robert Frost Junior High School, and Schaumburg High School.
Ownership History
Date
Name
Owned For
Owner Type
Purchase Details
Closed on
Oct 18, 2002
Sold by
Zielinski Dale A and Zielinski Kazumi K
Bought by
Pipercu Ionel and Pipercu Carmen
Current Estimated Value
Home Financials for this Owner
Home Financials are based on the most recent Mortgage that was taken out on this home.
Original Mortgage
$162,000
Outstanding Balance
$63,985
Interest Rate
5.37%
Estimated Equity
$235,056
Purchase Details
Closed on
May 29, 1997
Sold by
Peich Melvin S and Peich Jean
Bought by
Zielinski Dale A and Zielinski Kazumi K
Home Financials for this Owner
Home Financials are based on the most recent Mortgage that was taken out on this home.
Original Mortgage
$119,085
Interest Rate
8.13%
Mortgage Type
VA
Purchase Details
Closed on
Jan 18, 1996
Sold by
Peich Melvin S and Peich Jean
Bought by
Peich Melvin S and Peich Jean
Create a Home Valuation Report for This Property
The Home Valuation Report is an in-depth analysis detailing your home's value as well as a comparison with similar homes in the area
Home Values in the Area
Average Home Value in this Area
Purchase History
| Date | Buyer | Sale Price | Title Company |
|---|---|---|---|
| Pipercu Ionel | $180,000 | -- | |
| Zielinski Dale A | $117,000 | -- | |
| Peich Melvin S | -- | -- |
Source: Public Records
Mortgage History
| Date | Status | Borrower | Loan Amount |
|---|---|---|---|
| Open | Pipercu Ionel | $162,000 | |
| Previous Owner | Zielinski Dale A | $119,085 |
Source: Public Records
Tax History Compared to Growth
Tax History
| Year | Tax Paid | Tax Assessment Tax Assessment Total Assessment is a certain percentage of the fair market value that is determined by local assessors to be the total taxable value of land and additions on the property. | Land | Improvement |
|---|---|---|---|---|
| 2024 | $4,800 | $20,452 | $2,151 | $18,301 |
| 2023 | $4,626 | $20,452 | $2,151 | $18,301 |
| 2022 | $4,626 | $20,452 | $2,151 | $18,301 |
| 2021 | $3,311 | $14,255 | $1,406 | $12,849 |
| 2020 | $3,322 | $14,255 | $1,406 | $12,849 |
| 2019 | $3,359 | $15,962 | $1,406 | $14,556 |
| 2018 | $2,736 | $12,552 | $1,158 | $11,394 |
| 2017 | $2,711 | $12,552 | $1,158 | $11,394 |
| 2016 | $2,777 | $12,552 | $1,158 | $11,394 |
| 2015 | $3,135 | $13,101 | $1,075 | $12,026 |
| 2014 | $3,116 | $13,101 | $1,075 | $12,026 |
| 2013 | $3,019 | $13,101 | $1,075 | $12,026 |
Source: Public Records
Map
Nearby Homes
- 1518 Harbour Ct Unit A1
- 1471 Fairlane Dr Unit 2A
- 1467 Fairlane Dr Unit 1B
- 1662 Commodore Ct Unit 70294
- 1721 Chesapeake Ln Unit 4
- 1460 Fairlane Dr Unit 228
- 1463 Mercury Dr Unit 115
- 1463 Mercury Dr Unit 304
- 6908 Orchard Ln
- 1410 Brownstone Place Unit 38
- 7031 Glenwood Ln
- 1882 Keystone Place Unit 1882
- 6915 Hawthorne Ln
- 6938 Meadowbrook Ln
- 1102 Westover Ln Unit 1C
- 7468 Filmore Ave
- 6925 Edgebrook Ln
- 664 Wedgewood Dr
- 1011 Mercury Dr Unit 7
- 7138 Edgebrook Ln
- 1515 Harbour Ct Unit 32AL
- 1515 Harbour Ct Unit 31AL
- 1515 Harbour Ct Unit 31BL
- 1515 Harbour Ct Unit 2B
- 1515 Harbour Ct Unit 1B
- 1515 Harbour Ct Unit 1-A
- 1519 Harbour Ct Unit 32BR
- 1519 Harbour Ct Unit 31BR
- 1519 Harbour Ct Unit 31AR
- 1519 Harbour Ct Unit 32AR
- 1519 Harbour Ct Unit 2B
- 1519 Harbour Ct Unit 1A
- 1519 Harbour Ct Unit 2-A
- 1514 Commodore Ln Unit 7006-1
- 1514 Commodore Ln Unit 7006-4
- 1514 Commodore Ln Unit 2
- 1520 Commodore Ln Unit 70078
- 1520 Commodore Ln Unit 70077
- 1520 Commodore Ln Unit 70076
- 1520 Commodore Ln Unit 70075