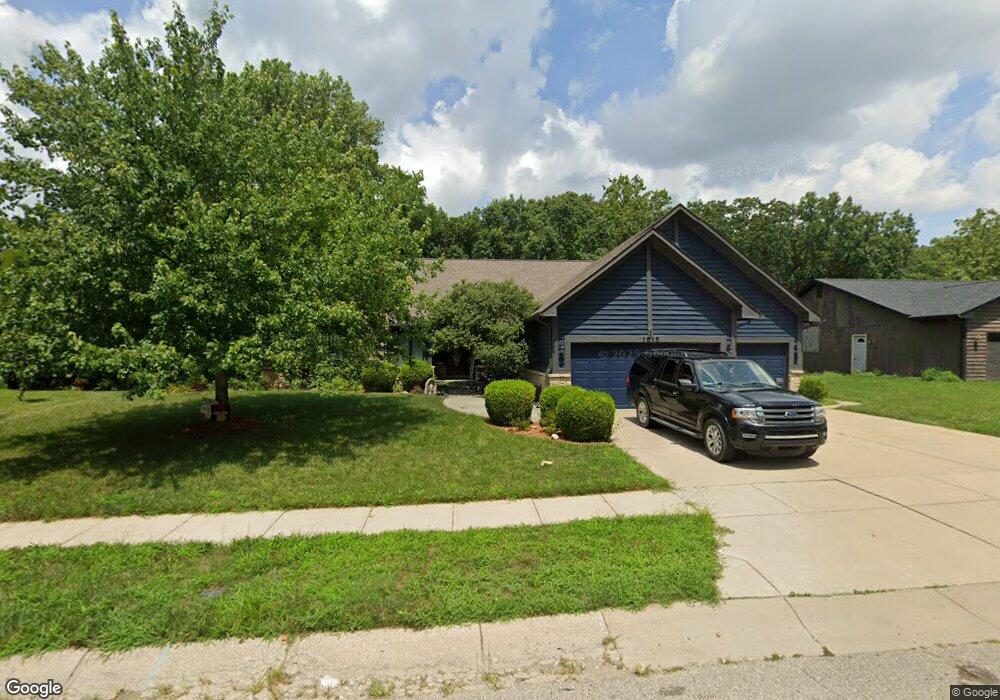
1515 Hickory Glenn Dr Miamisburg, OH 45342
Estimated Value: $367,000 - $395,000
3
Beds
3
Baths
2,629
Sq Ft
$144/Sq Ft
Est. Value
About This Home
This home is located at 1515 Hickory Glenn Dr, Miamisburg, OH 45342 and is currently estimated at $379,046, approximately $144 per square foot. 1515 Hickory Glenn Dr is a home located in Montgomery County with nearby schools including Miamisburg High School and Bethel Baptist School.
Ownership History
Date
Name
Owned For
Owner Type
Purchase Details
Closed on
May 28, 2019
Sold by
Nelson Carolyn A
Bought by
Holland Elizabeth A and Holland Joshua D
Current Estimated Value
Home Financials for this Owner
Home Financials are based on the most recent Mortgage that was taken out on this home.
Original Mortgage
$168,875
Outstanding Balance
$148,482
Interest Rate
4.1%
Mortgage Type
FHA
Estimated Equity
$230,564
Purchase Details
Closed on
Jun 2, 1998
Sold by
Williams Noel T and Williams Linda D
Bought by
Nelson William A and Nelson Carolyn A
Home Financials for this Owner
Home Financials are based on the most recent Mortgage that was taken out on this home.
Original Mortgage
$175,000
Interest Rate
7.27%
Purchase Details
Closed on
May 2, 1998
Sold by
Williams Noel T and Williams Linda D
Bought by
Nelson William A and Nelson Carolyn A
Home Financials for this Owner
Home Financials are based on the most recent Mortgage that was taken out on this home.
Original Mortgage
$175,000
Interest Rate
7.27%
Create a Home Valuation Report for This Property
The Home Valuation Report is an in-depth analysis detailing your home's value as well as a comparison with similar homes in the area
Home Values in the Area
Average Home Value in this Area
Purchase History
| Date | Buyer | Sale Price | Title Company |
|---|---|---|---|
| Holland Elizabeth A | $175,000 | Fidelity Lawyers Ttl Agcy Ll | |
| Nelson William A | $259,900 | Midland Title Security Inc | |
| Nelson William A | $259,900 | -- |
Source: Public Records
Mortgage History
| Date | Status | Borrower | Loan Amount |
|---|---|---|---|
| Open | Holland Elizabeth A | $168,875 | |
| Previous Owner | Nelson William A | $175,000 |
Source: Public Records
Tax History Compared to Growth
Tax History
| Year | Tax Paid | Tax Assessment Tax Assessment Total Assessment is a certain percentage of the fair market value that is determined by local assessors to be the total taxable value of land and additions on the property. | Land | Improvement |
|---|---|---|---|---|
| 2024 | $6,787 | $104,670 | $14,490 | $90,180 |
| 2023 | $6,787 | $104,670 | $14,490 | $90,180 |
| 2022 | $6,706 | $87,230 | $12,080 | $75,150 |
| 2021 | $5,952 | $87,230 | $12,080 | $75,150 |
| 2020 | $5,938 | $87,230 | $12,080 | $75,150 |
| 2019 | $4,548 | $71,610 | $10,500 | $61,110 |
| 2018 | $4,563 | $71,610 | $10,500 | $61,110 |
| 2017 | $4,532 | $71,610 | $10,500 | $61,110 |
| 2016 | $4,093 | $63,440 | $10,500 | $52,940 |
| 2015 | $4,013 | $63,440 | $10,500 | $52,940 |
| 2014 | $4,013 | $63,440 | $10,500 | $52,940 |
| 2012 | -- | $72,740 | $13,300 | $59,440 |
Source: Public Records
Map
Nearby Homes
- 1109 Sundance Dr
- 1803 Cudgell Dr
- 857 Lea Castle Place
- 429 Wilson Park Dr
- 1232 Hollyhill Dr
- 00 Heincke Rd
- 838 Maid Marion Ct
- 1000 Skyview Dr
- 308 Ironwood Dr
- 257 Ironwood Dr
- 250 Grantwood Dr
- 2125 Sherwood Forest Dr
- 700 N Gebhart Church Rd
- 1121 Dayket Cir
- 860 Mardel Dr
- 703 Friar Tuck Ct
- 2302 King Richard Pkwy
- 722 Peach Orchard Dr
- 00 Graceland Dr
- 765 Heincke Rd
- 1525 Hickory Glenn Dr
- 1505 Hickory Glenn Dr
- 1535 Hickory Glenn Dr
- 1516 Hickory Glenn Dr
- 1526 Hickory Glenn Dr
- 1160 N Heincke Rd
- 1536 Hickory Glenn Dr
- 1203 Pine Knoll Ct
- 1213 Pine Knoll Ct
- 1546 Hickory Glenn Dr
- 7901 Granite Peak Way
- 1161 N Heincke Rd
- 1515 Sherwood Forest Dr
- 1525 Sherwood Forest Dr
- 1218 N Heincke Rd
- 1140 N Heincke Rd
- 1535 Sherwood Forest Dr
- 1556 Hickory Glenn Dr
- 1212 Pine Knoll Ct
- 1545 Sherwood Forest Dr