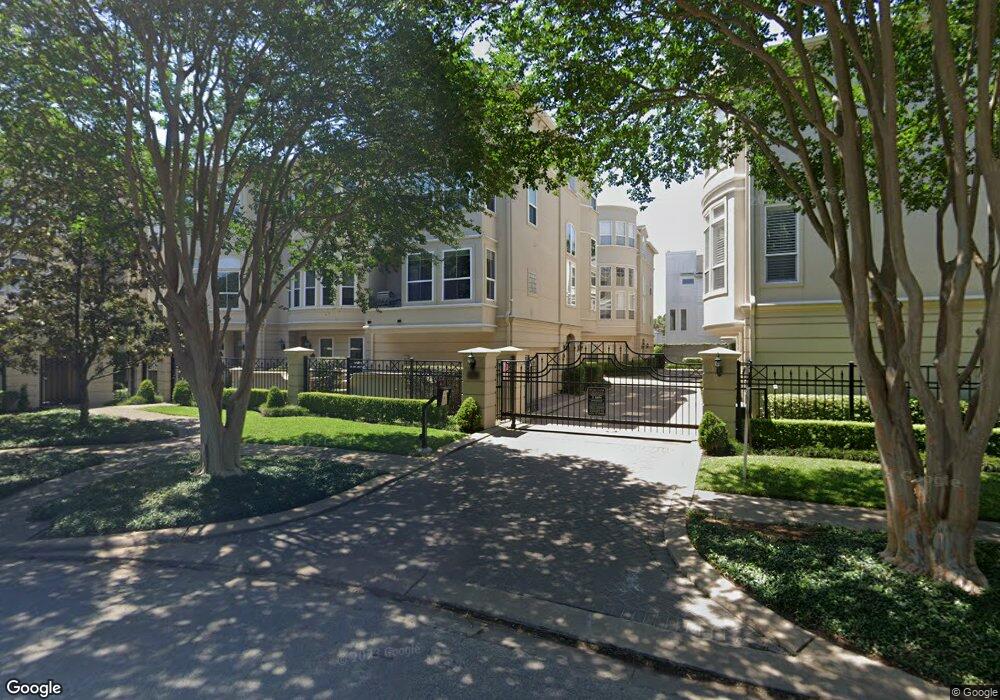
1515 Hyde Park Blvd Houston, TX 77006
Montrose NeighborhoodEstimated Value: $538,450 - $782,000
3
Beds
4
Baths
2,748
Sq Ft
$226/Sq Ft
Est. Value
About This Home
This home is located at 1515 Hyde Park Blvd, Houston, TX 77006 and is currently estimated at $621,863, approximately $226 per square foot. 1515 Hyde Park Blvd is a home located in Harris County with nearby schools including Baker Montessori, Lanier Middle School, and Lamar High School.
Ownership History
Date
Name
Owned For
Owner Type
Purchase Details
Closed on
Jun 13, 2022
Sold by
Divcon Global Services Inc
Bought by
Magnus Real Estate Llc
Current Estimated Value
Purchase Details
Closed on
May 26, 2022
Sold by
Antonio Pinon Marco
Bought by
Gazelle Gazelles
Purchase Details
Closed on
Apr 17, 2015
Sold by
Munroe John Robert and Dalea Raluca Zina
Bought by
Tu Tsung Yu
Purchase Details
Closed on
Nov 13, 2012
Sold by
Osburn Kim A and Warnica James M
Bought by
Munroe John Robert and Dalea Raluca Zina
Purchase Details
Closed on
Feb 22, 2002
Sold by
Stature Construction Inc
Bought by
Osburn Kim A
Home Financials for this Owner
Home Financials are based on the most recent Mortgage that was taken out on this home.
Original Mortgage
$290,320
Interest Rate
7.05%
Mortgage Type
Purchase Money Mortgage
Create a Home Valuation Report for This Property
The Home Valuation Report is an in-depth analysis detailing your home's value as well as a comparison with similar homes in the area
Home Values in the Area
Average Home Value in this Area
Purchase History
| Date | Buyer | Sale Price | Title Company |
|---|---|---|---|
| Magnus Real Estate Llc | -- | Providence Title Company | |
| Gazelle Gazelles | -- | Laird Law Firm Pc | |
| Tu Tsung Yu | -- | Chicago Title | |
| Munroe John Robert | -- | None Available | |
| Osburn Kim A | -- | Texas American Title Company |
Source: Public Records
Mortgage History
| Date | Status | Borrower | Loan Amount |
|---|---|---|---|
| Previous Owner | Osburn Kim A | $290,320 | |
| Closed | Osburn Kim A | $36,290 |
Source: Public Records
Tax History Compared to Growth
Tax History
| Year | Tax Paid | Tax Assessment Tax Assessment Total Assessment is a certain percentage of the fair market value that is determined by local assessors to be the total taxable value of land and additions on the property. | Land | Improvement |
|---|---|---|---|---|
| 2025 | $10,499 | $524,696 | $183,540 | $341,156 |
| 2024 | $10,499 | $501,796 | $173,880 | $327,916 |
| 2023 | $10,499 | $520,329 | $173,880 | $346,449 |
| 2022 | $10,398 | $472,224 | $173,880 | $298,344 |
| 2021 | $10,926 | $468,800 | $144,900 | $323,900 |
| 2020 | $11,354 | $468,880 | $144,900 | $323,980 |
| 2019 | $10,962 | $433,191 | $120,624 | $312,567 |
| 2018 | $11,416 | $451,154 | $103,392 | $347,762 |
| 2017 | $12,273 | $462,500 | $103,392 | $359,108 |
| 2016 | $12,488 | $470,600 | $103,392 | $367,208 |
| 2015 | $8,587 | $503,661 | $103,392 | $400,269 |
| 2014 | $8,587 | $432,894 | $86,160 | $346,734 |
Source: Public Records
Map
Nearby Homes
- 1515 Hyde Park Blvd Unit 1
- 2516 Commonwealth St Unit 102
- 2403 Commonwealth St
- 1621 Haver St
- 1621 Cherryhurst St
- 2410 Waugh Dr Unit 4C
- 2410 Waugh Dr Unit 3
- 1406 Fairview Ave
- 1709 Haver St
- 2407 Waugh Dr
- 1316 Hyde Park Blvd
- 1621 California St
- 1406 Maryland St
- 3311 Yupon St Unit 611
- 3311 Yupon St Unit 519
- 1705 Michigan St
- 2100 Commonwealth St Unit E
- 2100 Commonwealth St Unit G
- 1409 Indiana St
- 1407 Indiana St
- 1515 Hyde Park Blvd
- 1515 Hyde Park Blvd
- 1515 Hyde Park Blvd
- 1515 Hyde Park Blvd
- 1515 Hyde Park Blvd
- 1515 Hyde Park Blvd Unit 29
- 1515 Hyde Park Blvd
- 1515 Hyde Park Blvd
- 1515 Hyde Park Blvd
- 1515 Hyde Park Blvd
- 1515 Hyde Park Blvd
- 1515 Hyde Park Blvd
- 1515 Hyde Park Blvd Unit 31
- 1515 Hyde Park Blvd
- 1515 Hyde Park Blvd
- 1515 Hyde Park Blvd
- 1515 Hyde Park Blvd
- 1515 Hyde Park Blvd
- 1515 Hyde Park Blvd
- 1515 Hyde Park Blvd Unit 25