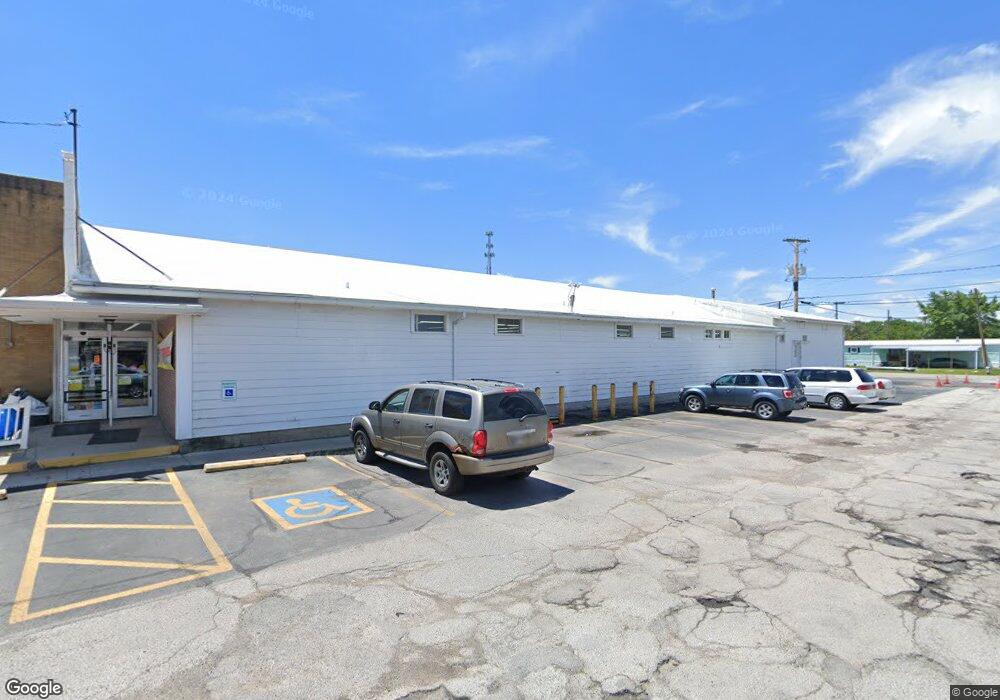
1515 N Countyline St Fostoria, OH 44830
Estimated Value: $296,774
--
Bed
--
Bath
13,295
Sq Ft
$22/Sq Ft
Est. Value
About This Home
This home is located at 1515 N Countyline St, Fostoria, OH 44830 and is currently priced at $296,774, approximately $22 per square foot. 1515 N Countyline St is a home located in Wood County with nearby schools including Fostoria Intermediate Elementary School and Fostoria Junior/Senior High School.
Ownership History
Date
Name
Owned For
Owner Type
Purchase Details
Closed on
Jan 28, 2019
Sold by
Hanks David and Estate Of Lawrence Richard Ber
Bought by
Motte & Bailey Assets Llc
Current Estimated Value
Home Financials for this Owner
Home Financials are based on the most recent Mortgage that was taken out on this home.
Original Mortgage
$178,500
Outstanding Balance
$156,613
Interest Rate
4.4%
Mortgage Type
Future Advance Clause Open End Mortgage
Purchase Details
Closed on
Jan 27, 2017
Sold by
Sacks Harris
Bought by
Berman Lawrence
Purchase Details
Closed on
Mar 5, 2013
Sold by
Sacks Rebecca R
Bought by
Sacks Rebecca R
Purchase Details
Closed on
Nov 14, 2002
Sold by
Sacks Theodore N and Sacks Rebecca R
Bought by
Sacks Theodore N and Sacks Rebecca R
Purchase Details
Closed on
Dec 15, 1982
Bought by
Sacks Theodore N
Create a Home Valuation Report for This Property
The Home Valuation Report is an in-depth analysis detailing your home's value as well as a comparison with similar homes in the area
Home Values in the Area
Average Home Value in this Area
Purchase History
| Date | Buyer | Sale Price | Title Company |
|---|---|---|---|
| Motte & Bailey Assets Llc | $210,000 | None Available | |
| Berman Lawrence | $217,500 | None Available | |
| Sacks Harris | -- | None Available | |
| Sacks Rebecca R | -- | None Available | |
| Sacks Theodore N | -- | -- | |
| Sacks Theodore N | $53,500 | -- |
Source: Public Records
Mortgage History
| Date | Status | Borrower | Loan Amount |
|---|---|---|---|
| Open | Motte & Bailey Assets Llc | $178,500 |
Source: Public Records
Tax History Compared to Growth
Tax History
| Year | Tax Paid | Tax Assessment Tax Assessment Total Assessment is a certain percentage of the fair market value that is determined by local assessors to be the total taxable value of land and additions on the property. | Land | Improvement |
|---|---|---|---|---|
| 2024 | $5,391 | $72,415 | $28,070 | $44,345 |
| 2023 | $5,391 | $72,420 | $28,070 | $44,350 |
| 2021 | $5,830 | $69,440 | $26,600 | $42,840 |
| 2020 | $5,872 | $69,440 | $26,600 | $42,840 |
| 2019 | $5,845 | $69,440 | $26,600 | $42,840 |
| 2018 | $5,885 | $69,440 | $26,600 | $42,840 |
| 2017 | $2,656 | $69,440 | $26,600 | $42,840 |
| 2016 | $5,247 | $68,990 | $26,600 | $42,390 |
| 2015 | $5,247 | $68,990 | $26,600 | $42,390 |
| 2014 | $5,364 | $68,990 | $26,600 | $42,390 |
| 2013 | $5,605 | $68,990 | $26,600 | $42,390 |
Source: Public Records
Map
Nearby Homes
- 375 Thomas St
- 1324 N Union St
- 900 N Countyline St
- 727 Eisenhower Dr
- 892 N Countyline St
- 901 Central Ave
- 931 N Union St
- 723 N Union St
- 633 Maple St
- 827 Buckley St
- 520 N Union St
- 540 N Poplar St
- 220 E High St
- 711 Circle Dr
- 509 College Ave
- 203 N Union St
- 481 Beverly Dr
- 425 W Ridge Dr Unit U5
- 1401 Van Buren St Unit U24
- 1401 Van Buren St Unit U21
- 1515 N County Line St
- 1441 N Countyline St
- 1441 N Countyline St
- 1441 N County Line St
- 1601 N County Line St
- 1601 N Countyline St
- 1521 N Countyline St Unit 115
- 1521 N Countyline St
- 1521 N Countyline St Unit 89
- 1439 N County Line St
- 1439 N Countyline St
- 444 Beech St
- 423 Kennard St
- 442 Beech St
- 449 Beech St
- 419 Kennard St
- 411 Kennard St
- 437 Beech St
- 408 Kennard St
- 1402 N Countyline St