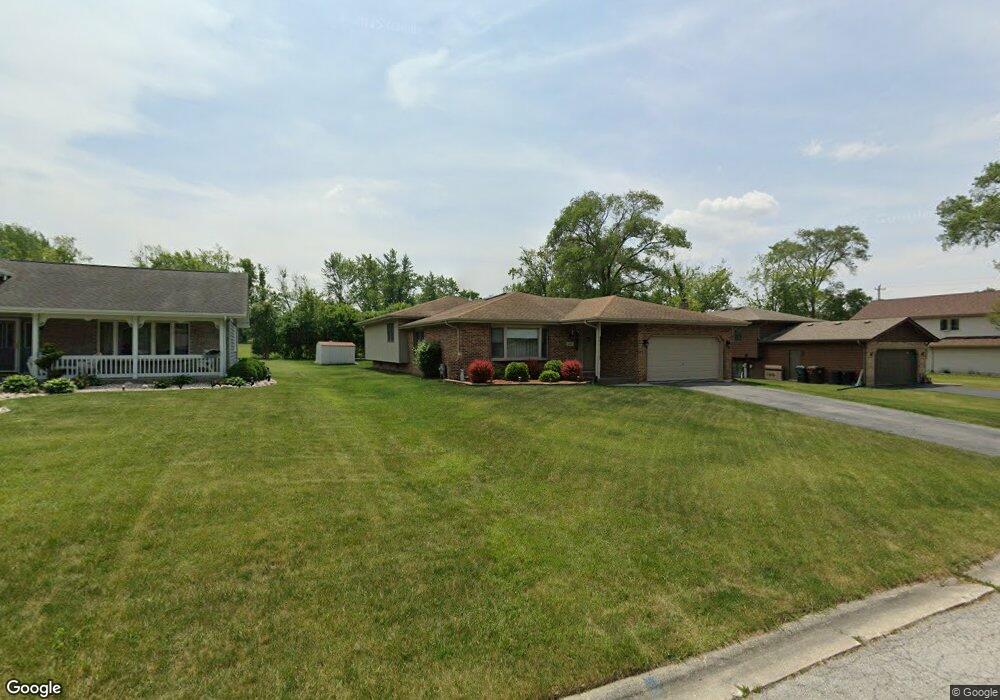
1515 Pine Trace Ct University Park, IL 60484
Estimated Value: $222,000 - $351,000
3
Beds
3
Baths
1,983
Sq Ft
$143/Sq Ft
Est. Value
About This Home
This home is located at 1515 Pine Trace Ct, University Park, IL 60484 and is currently estimated at $282,603, approximately $142 per square foot. 1515 Pine Trace Ct is a home located in Will County with nearby schools including Talala Elementary School, Crete-Monee Middle School, and Crete-Monee High School.
Ownership History
Date
Name
Owned For
Owner Type
Purchase Details
Closed on
Aug 12, 2009
Sold by
Thatch Kim R and Mcdavid Kim
Bought by
Simpson Arlene
Current Estimated Value
Home Financials for this Owner
Home Financials are based on the most recent Mortgage that was taken out on this home.
Original Mortgage
$181,649
Outstanding Balance
$118,858
Interest Rate
5.28%
Mortgage Type
FHA
Estimated Equity
$163,745
Purchase Details
Closed on
Feb 12, 2002
Sold by
Bostian John D and Bostian Rebecca R
Bought by
Mcdavid Kim
Home Financials for this Owner
Home Financials are based on the most recent Mortgage that was taken out on this home.
Original Mortgage
$150,750
Interest Rate
8.75%
Purchase Details
Closed on
Aug 11, 1995
Sold by
Bridgeview Bank & Trust Company
Bought by
Sayre Lynn and Sayre Cyndi
Home Financials for this Owner
Home Financials are based on the most recent Mortgage that was taken out on this home.
Original Mortgage
$78,000
Interest Rate
7.37%
Create a Home Valuation Report for This Property
The Home Valuation Report is an in-depth analysis detailing your home's value as well as a comparison with similar homes in the area
Home Values in the Area
Average Home Value in this Area
Purchase History
| Date | Buyer | Sale Price | Title Company |
|---|---|---|---|
| Simpson Arlene | $185,000 | Multiple | |
| Mcdavid Kim | $167,500 | Ticor Title | |
| Sayre Lynn | $150,000 | Title One |
Source: Public Records
Mortgage History
| Date | Status | Borrower | Loan Amount |
|---|---|---|---|
| Open | Simpson Arlene | $181,649 | |
| Previous Owner | Mcdavid Kim | $150,750 | |
| Previous Owner | Sayre Lynn | $78,000 |
Source: Public Records
Tax History Compared to Growth
Tax History
| Year | Tax Paid | Tax Assessment Tax Assessment Total Assessment is a certain percentage of the fair market value that is determined by local assessors to be the total taxable value of land and additions on the property. | Land | Improvement |
|---|---|---|---|---|
| 2024 | $8,480 | $75,561 | $13,027 | $62,534 |
| 2023 | $8,480 | $65,139 | $11,230 | $53,909 |
| 2022 | $7,230 | $57,301 | $9,879 | $47,422 |
| 2021 | $7,034 | $55,187 | $9,074 | $46,113 |
| 2020 | $7,164 | $53,398 | $8,780 | $44,618 |
| 2019 | $7,239 | $50,638 | $8,326 | $42,312 |
| 2018 | $7,201 | $49,519 | $8,142 | $41,377 |
| 2017 | $7,387 | $49,666 | $7,886 | $41,780 |
| 2016 | $7,091 | $49,638 | $7,597 | $42,041 |
| 2015 | $6,910 | $49,145 | $7,505 | $41,640 |
| 2014 | $6,910 | $48,466 | $7,401 | $41,065 |
| 2013 | $6,910 | $50,750 | $7,750 | $43,000 |
Source: Public Records
Map
Nearby Homes
- 901 Cityscape Ln
- 900 Mesa Ct
- 438 Tamarack St
- 425 Tamarack St
- 23345 Central Park Ave
- 478 Talala St
- 481 Talala St
- 240 Tampa St
- 456 Tomahawk St
- 236 Tampa St
- 453 Titonka St
- 23936 S Home Ave
- 224 Shabbona Dr
- Lot 1 W Stuenkel Rd
- 426 Tomahawk St
- 480 Shabbona Dr
- 471 Indianwood Blvd
- 331 Somonauk St
- 329 Somonauk St
- 24306 S Governors Hwy
- 1519 Pine Trace Ct
- 1511 Pine Trace Ct
- 1507 Pine Trace Ct
- 1523 Pine Trace Ct
- 1510 Pine Trace Ct
- 1503 Pine Trace Ct
- 24023 S Crawford Ave
- 1514 Pine Trace Ct
- 1506 Pine Trace Ct
- 1527 Pine Trace Ct
- 24037 S Crawford Ave
- 1531 Pine Trace Ct
- 1502 Pine Trace Ct
- 1530 Pine Trace Ct
- 1518 Pine Trace Ct
- 1522 Pine Trace Ct
- 1526 Pine Trace Ct
- 3448 University Pkwy
- 24057 S Crawford Ave
- 1046 W Stuenkel Rd