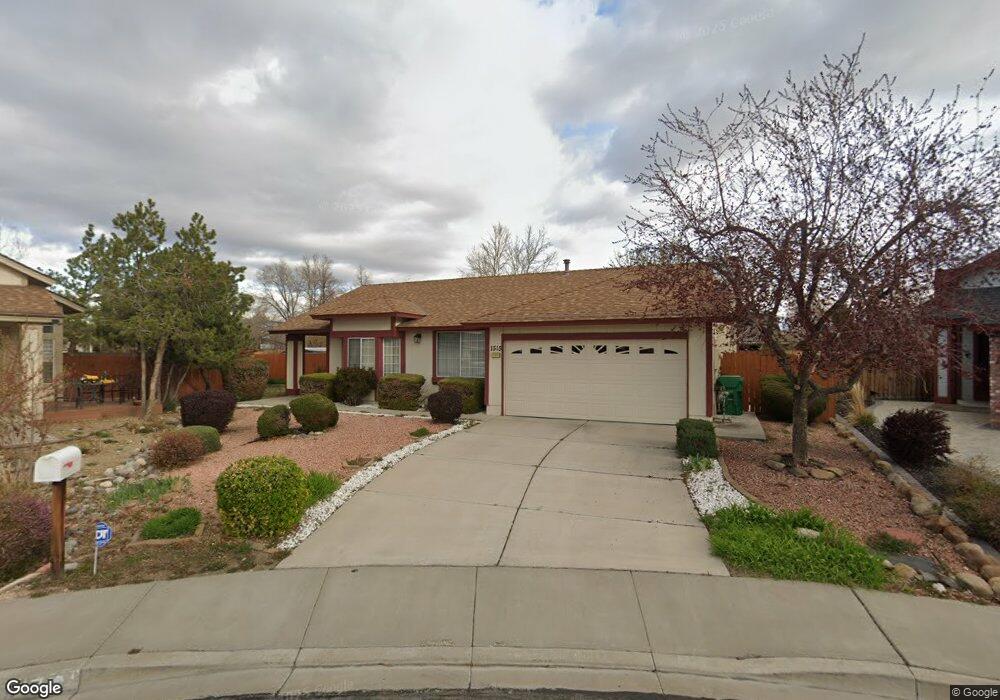
1515 Rheingold Ct Sparks, NV 89434
Reed NeighborhoodEstimated Value: $509,898 - $526,000
4
Beds
2
Baths
1,876
Sq Ft
$276/Sq Ft
Est. Value
About This Home
This home is located at 1515 Rheingold Ct, Sparks, NV 89434 and is currently estimated at $518,475, approximately $276 per square foot. 1515 Rheingold Ct is a home located in Washoe County with nearby schools including Lloyd Diedrichsen Elementary School, Lou Mendive Middle School, and Edward C Reed High School.
Ownership History
Date
Name
Owned For
Owner Type
Purchase Details
Closed on
Dec 14, 2016
Sold by
Mendenhall Xuan T and Mendenhall Kenneth Monroe
Bought by
Mendenhall Xuan T
Current Estimated Value
Home Financials for this Owner
Home Financials are based on the most recent Mortgage that was taken out on this home.
Original Mortgage
$206,100
Interest Rate
3.94%
Mortgage Type
New Conventional
Purchase Details
Closed on
Aug 24, 2004
Sold by
Mendenhall Michael Kane
Bought by
Mendenhall Kenneth M and Mendenhall Xuan T
Home Financials for this Owner
Home Financials are based on the most recent Mortgage that was taken out on this home.
Original Mortgage
$210,000
Interest Rate
5.95%
Mortgage Type
New Conventional
Create a Home Valuation Report for This Property
The Home Valuation Report is an in-depth analysis detailing your home's value as well as a comparison with similar homes in the area
Home Values in the Area
Average Home Value in this Area
Purchase History
| Date | Buyer | Sale Price | Title Company |
|---|---|---|---|
| Mendenhall Xuan T | -- | None Available | |
| Mendenhall Kenneth M | -- | First American Title |
Source: Public Records
Mortgage History
| Date | Status | Borrower | Loan Amount |
|---|---|---|---|
| Closed | Mendenhall Xuan T | $206,100 | |
| Closed | Mendenhall Kenneth M | $210,000 |
Source: Public Records
Tax History Compared to Growth
Tax History
| Year | Tax Paid | Tax Assessment Tax Assessment Total Assessment is a certain percentage of the fair market value that is determined by local assessors to be the total taxable value of land and additions on the property. | Land | Improvement |
|---|---|---|---|---|
| 2026 | $1,846 | $91,027 | $36,890 | $54,137 |
| 2025 | $2,406 | $91,568 | $36,120 | $55,448 |
| 2024 | $2,338 | $89,386 | $33,215 | $56,172 |
| 2023 | $1,690 | $88,658 | $35,175 | $53,483 |
| 2022 | $2,270 | $71,549 | $26,740 | $44,809 |
| 2021 | $2,205 | $66,539 | $21,735 | $44,804 |
| 2020 | $2,140 | $65,822 | $20,720 | $45,102 |
| 2019 | $2,078 | $64,514 | $20,720 | $43,794 |
| 2018 | $2,011 | $57,498 | $14,455 | $43,043 |
| 2017 | $1,955 | $56,996 | $13,720 | $43,276 |
| 2016 | $1,907 | $56,555 | $12,250 | $44,305 |
| 2015 | $1,904 | $54,935 | $10,325 | $44,610 |
| 2014 | $1,850 | $52,052 | $9,030 | $43,022 |
| 2013 | -- | $49,190 | $6,860 | $42,330 |
Source: Public Records
Map
Nearby Homes
- 1866 Pocono Ct
- 1332 Coachman Ct
- 1770 Burnside Dr
- 2002 Wabash Cir
- 1290 Highgate Ct
- 1218 Junction Dr
- 1544 Woodhaven Ln
- 1757 Bluehaven Dr
- 1990 Fargo Way
- 1280 O'Callaghan Dr
- 2252 Sycamore Glen Dr
- 1005 Amico Dr
- 675 Parlanti Ln Unit 52
- 675 Parlanti Ln Unit 124
- 675 Parlanti Ln Unit 42
- 675 Parlanti Ln
- 675 Parlanti Ln Unit 88
- 675 Parlanti Ln Unit 63
- 2119 Avella Dr
- 2407 Sunny Slope Dr Unit 1
- 1525 Rheingold Ct
- 934 Coal Ct
- 1514 Rheingold Ct
- 938 Coal Ct
- 1524 Rheingold Ct
- 1535 Rheingold Ct
- 935 Coal Ct
- 944 Coal Ct
- 1534 Rheingold Ct
- 1545 Rheingold Ct
- 945 Coal Ct
- 924 Locomotive Way
- 934 Locomotive Way
- 914 Locomotive Way
- 944 Locomotive Way
- 954 Coal Ct
- 1555 Rheingold Ct
- 955 Coal Ct
- 910 Locomotive Way
- 954 Locomotive Way