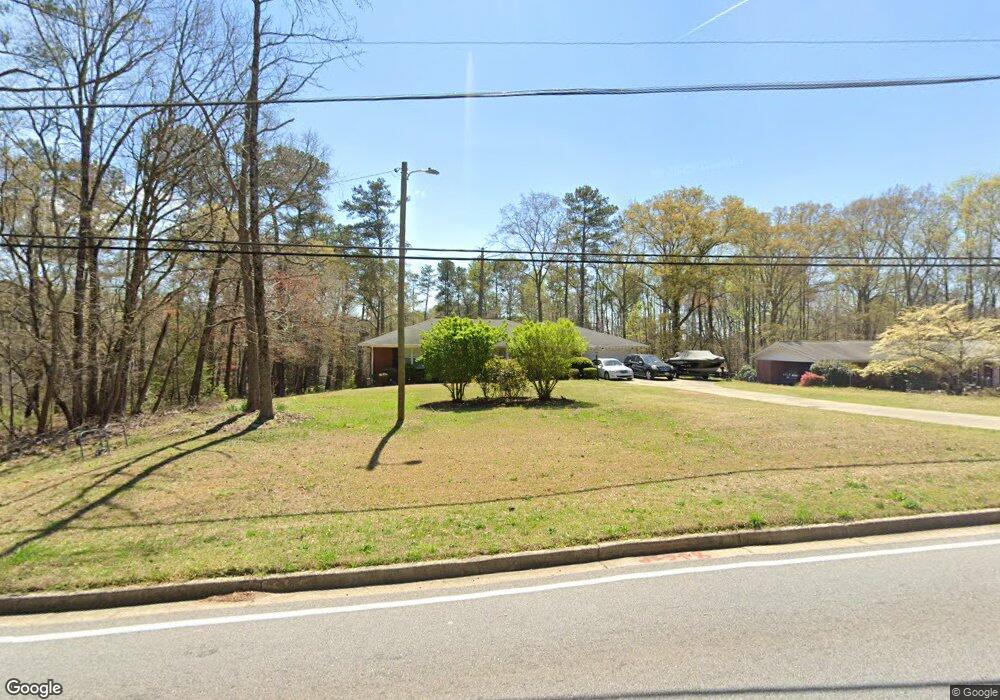
1515 S Gordon Rd Austell, GA 30168
Estimated Value: $248,000 - $364,000
3
Beds
3
Baths
3,224
Sq Ft
$101/Sq Ft
Est. Value
About This Home
This home is located at 1515 S Gordon Rd, Austell, GA 30168 and is currently estimated at $327,025, approximately $101 per square foot. 1515 S Gordon Rd is a home located in Cobb County with nearby schools including Bryant Elementary School, Lindley Middle School, and Pebblebrook High School.
Ownership History
Date
Name
Owned For
Owner Type
Purchase Details
Closed on
Sep 20, 2007
Sold by
Alioha Helen and Alioha George
Bought by
Owen Winston N and Tate Owen Janice
Current Estimated Value
Home Financials for this Owner
Home Financials are based on the most recent Mortgage that was taken out on this home.
Original Mortgage
$17,050
Outstanding Balance
$10,734
Interest Rate
6.55%
Mortgage Type
New Conventional
Estimated Equity
$316,291
Purchase Details
Closed on
Sep 14, 2001
Sold by
Geiger Cynthia R and Geiger Gilbert D
Bought by
Alioha Helen and Alioha George
Home Financials for this Owner
Home Financials are based on the most recent Mortgage that was taken out on this home.
Original Mortgage
$173,350
Interest Rate
6.89%
Mortgage Type
New Conventional
Purchase Details
Closed on
Jun 23, 1994
Sold by
Compton Bonnie B
Bought by
Geiger Cynthia R
Home Financials for this Owner
Home Financials are based on the most recent Mortgage that was taken out on this home.
Original Mortgage
$69,400
Interest Rate
8.28%
Create a Home Valuation Report for This Property
The Home Valuation Report is an in-depth analysis detailing your home's value as well as a comparison with similar homes in the area
Home Values in the Area
Average Home Value in this Area
Purchase History
| Date | Buyer | Sale Price | Title Company |
|---|---|---|---|
| Owen Winston N | $179,000 | -- | |
| Alioha Helen | $184,500 | -- | |
| Geiger Cynthia R | $86,800 | -- |
Source: Public Records
Mortgage History
| Date | Status | Borrower | Loan Amount |
|---|---|---|---|
| Open | Owen Winston N | $17,050 | |
| Previous Owner | Alioha Helen | $173,350 | |
| Previous Owner | Geiger Cynthia R | $69,400 |
Source: Public Records
Tax History Compared to Growth
Tax History
| Year | Tax Paid | Tax Assessment Tax Assessment Total Assessment is a certain percentage of the fair market value that is determined by local assessors to be the total taxable value of land and additions on the property. | Land | Improvement |
|---|---|---|---|---|
| 2025 | $697 | $133,704 | $60,800 | $72,904 |
| 2024 | $700 | $133,704 | $60,800 | $72,904 |
| 2023 | $407 | $104,760 | $56,000 | $48,760 |
| 2022 | $550 | $83,776 | $41,600 | $42,176 |
| 2021 | $508 | $69,700 | $33,600 | $36,100 |
| 2020 | $480 | $60,100 | $24,000 | $36,100 |
| 2019 | $480 | $60,100 | $24,000 | $36,100 |
| 2018 | $349 | $37,888 | $12,800 | $25,088 |
| 2017 | $306 | $37,888 | $12,800 | $25,088 |
| 2016 | $282 | $35,436 | $12,000 | $23,436 |
| 2015 | $617 | $29,788 | $8,000 | $21,788 |
| 2014 | $574 | $28,164 | $0 | $0 |
Source: Public Records
Map
Nearby Homes
- 1576 S Gordon Rd
- 6651 Malvin Dr
- 6675 S Dillon Rd
- 6445 Sherwood Trail
- 1310 Dillon Rd
- 6243 David Ln SW
- 1784 Brandemere Dr Unit 3
- 6609 Crossing Creek Point
- 1202 Pisgah Rd SW
- 1151 S Gordon Rd
- 6736 Ivy Log Dr
- 6992 Ivy Pointe Row
- 1550 Greenbrook Dr
- 840 Revena Dr
- 1507 Locust Log Way
- 1065 Stoney Creek Ln Unit 2
- 1426 Thunderwood Ln SW
- 1529 S Gordon Rd
- 6552 Martins Creek Dr
- 6556 Martins Creek Dr
- 6560 Martins Creek Dr
- 1481 S Gordon Rd
- 6568 Martins Creek Dr
- 1460 S Gordon Rd
- 6545 S Dillon Rd
- 6551 Martins Creek Dr
- 1546 S Gordon Rd
- 6555 Martins Creek Dr
- 6559 Martins Creek Dr
- 1450 S Gordon Rd
- 6563 Martins Creek Dr
- 1470 S Gordon
- 6528 S Dillon Rd
- 6567 Martins Creek Dr
- 6571 Martins Creek Dr
- 6546 S Dillon Rd
- 6579 Martins Creek Dr