
Seller's Agent in 2022
Scott Eoff
RE/MAX Results Plus
267 in this area
465 Total Sales
Estimated Value: $155,147
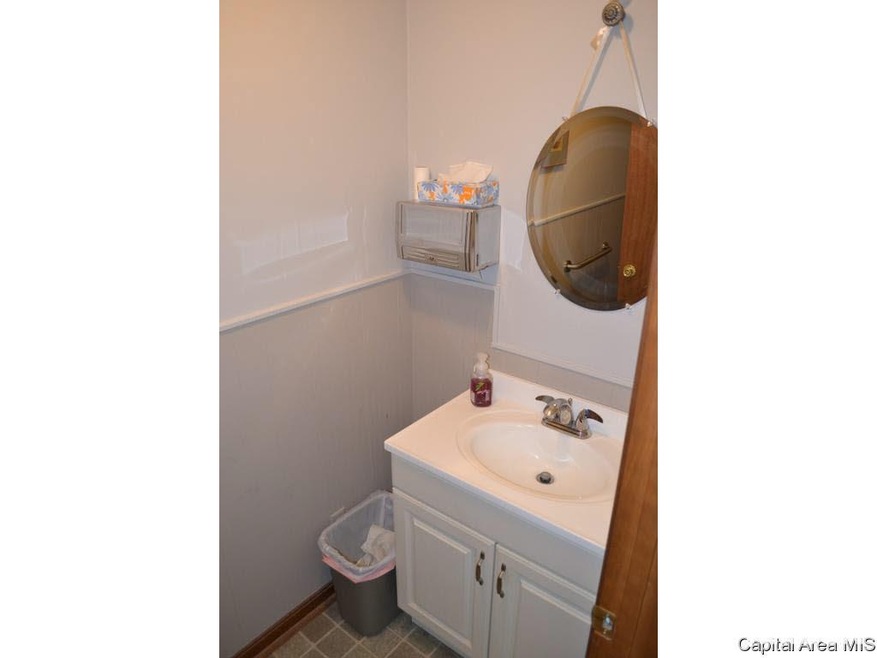
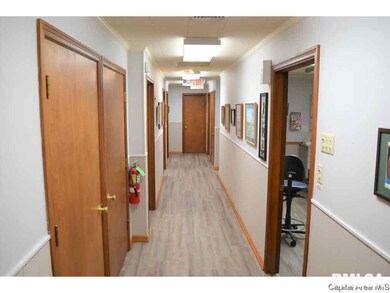
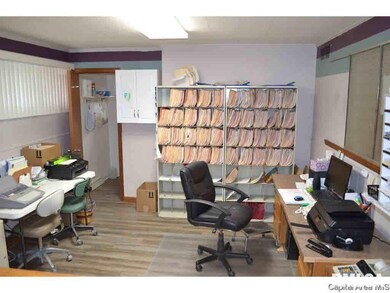
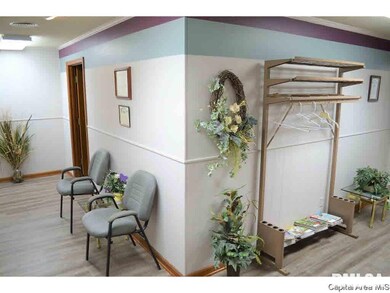
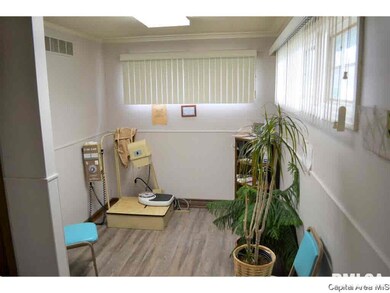
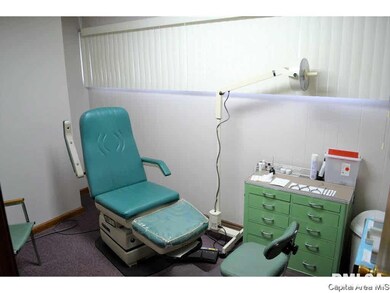
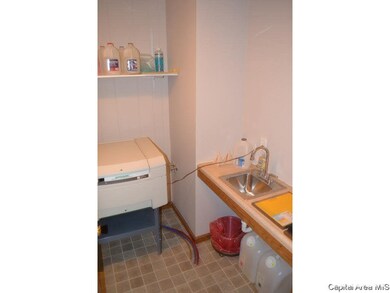
Building for Sale. Building is currently two separate offices. North side was Dental office and is now vacant. South side is leased. Building is 3521 Main floor sq feet with full basement. Two separate offices in this building. South side is rented for $800 Month on a 5 year lease. 4 years remain on that graduated lease agreement. Call agent for details.
Last Agent to Sell the Property
RE/MAX Results Plus License #471007845 Listed on: 04/18/2019
| Date | Buyer | Sale Price | Title Company |
|---|---|---|---|
| Aring Enterprises Llc | $119,900 | None Listed On Document |
| Date | Status | Borrower | Loan Amount |
|---|---|---|---|
| Open | Aring Enterprises Llc | $95,920 |
| Date | Event | Price | List to Sale | Price per Sq Ft |
|---|---|---|---|---|
| 03/31/2022 03/31/22 | Sold | $119,900 | 0.0% | $34 / Sq Ft |
| 02/26/2022 02/26/22 | For Sale | $119,900 | 0.0% | $34 / Sq Ft |
| 02/25/2022 02/25/22 | Off Market | $119,900 | -- | -- |
| 12/02/2021 12/02/21 | Pending | -- | -- | -- |
| 01/31/2021 01/31/21 | For Sale | $119,900 | 0.0% | $34 / Sq Ft |
| 01/28/2021 01/28/21 | Pending | -- | -- | -- |
| 11/06/2020 11/06/20 | For Sale | $119,900 | 0.0% | $34 / Sq Ft |
| 09/19/2020 09/19/20 | Off Market | $119,900 | -- | -- |
| 09/10/2020 09/10/20 | Price Changed | $119,900 | -14.3% | $34 / Sq Ft |
| 07/20/2020 07/20/20 | For Sale | $139,900 | +16.7% | $40 / Sq Ft |
| 07/19/2020 07/19/20 | Off Market | $119,900 | -- | -- |
| 07/06/2020 07/06/20 | Price Changed | $139,900 | -6.7% | $40 / Sq Ft |
| 05/20/2020 05/20/20 | For Sale | $149,900 | +25.0% | $43 / Sq Ft |
| 05/19/2020 05/19/20 | Off Market | $119,900 | -- | -- |
| 04/06/2020 04/06/20 | Price Changed | $149,900 | -6.3% | $43 / Sq Ft |
| 01/21/2020 01/21/20 | For Sale | $159,900 | 0.0% | $45 / Sq Ft |
| 01/21/2020 01/21/20 | Price Changed | $159,900 | +33.4% | $45 / Sq Ft |
| 01/19/2020 01/19/20 | Off Market | $119,900 | -- | -- |
| 10/21/2019 10/21/19 | For Sale | $169,900 | +41.7% | $48 / Sq Ft |
| 10/19/2019 10/19/19 | Off Market | $119,900 | -- | -- |
| 09/03/2019 09/03/19 | Price Changed | $169,900 | -10.5% | $48 / Sq Ft |
| 04/18/2019 04/18/19 | For Sale | $189,900 | -- | $54 / Sq Ft |
| Year | Tax Paid | Tax Assessment Tax Assessment Total Assessment is a certain percentage of the fair market value that is determined by local assessors to be the total taxable value of land and additions on the property. | Land | Improvement |
|---|---|---|---|---|
| 2024 | $4,159 | $100,750 | $13,860 | $86,890 |
| 2023 | $3,768 | $39,970 | $13,860 | $26,110 |
| 2022 | $3,808 | $39,970 | $13,860 | $26,110 |
| 2021 | $8,836 | $94,730 | $13,860 | $80,870 |
| 2020 | $7,863 | $82,630 | $13,860 | $68,770 |
| 2019 | $7,806 | $82,630 | $13,860 | $68,770 |
| 2018 | $9,086 | $99,710 | $13,890 | $85,820 |
| 2017 | $8,886 | $99,710 | $13,890 | $85,820 |
| 2016 | $8,538 | $94,820 | $13,230 | $81,590 |
| 2015 | $8,433 | $92,050 | $12,840 | $79,210 |
| 2014 | $8,433 | $92,050 | $12,840 | $79,210 |
| 2013 | $7,956 | $92,050 | $12,840 | $79,210 |
Seller's Agent in 2022
Scott Eoff
RE/MAX Results Plus
267 in this area
465 Total Sales
Buyer's Agent in 2022
Kerris Osborn
The Real Estate Group, Inc.
(217) 491-0991
115 in this area
198 Total Sales
Source: RMLS Alliance
MLS Number: RMACA192376
APN: 09-18-301-014
Disclaimer: Certain information contained herein is derived from information provided by parties other than Homes.com. All information provided is deemed reliable, but is not guaranteed to be accurate and should be independently verified.
![]() IDX information is provided exclusively for personal, non-commercial use, and may not be used for any purpose other than to identify prospective properties consumers may be interested in purchasing. Information is deemed reliable but not guaranteed.
IDX information is provided exclusively for personal, non-commercial use, and may not be used for any purpose other than to identify prospective properties consumers may be interested in purchasing. Information is deemed reliable but not guaranteed.