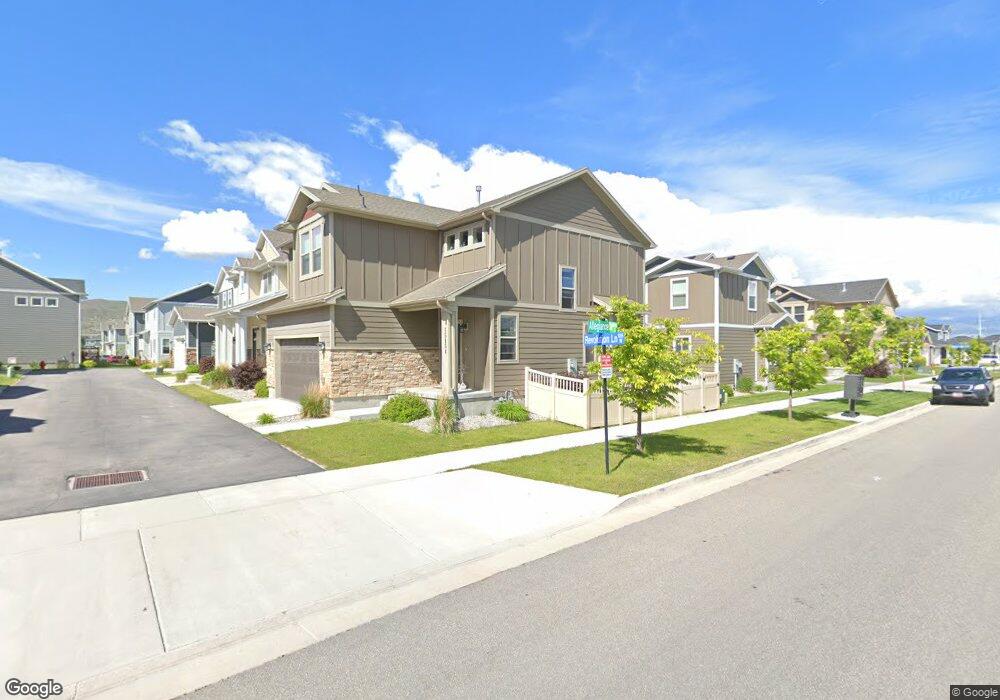
15154 S Revolution Ln Riverton, UT 84065
Estimated Value: $576,000 - $624,000
3
Beds
3
Baths
2,863
Sq Ft
$213/Sq Ft
Est. Value
About This Home
This home is located at 15154 S Revolution Ln, Riverton, UT 84065 and is currently estimated at $609,718, approximately $212 per square foot. 15154 S Revolution Ln is a home located in Salt Lake County with nearby schools including Mountain Point Elementary School, Hidden Valley Middle School, and Riverton High School.
Ownership History
Date
Name
Owned For
Owner Type
Purchase Details
Closed on
Dec 28, 2020
Sold by
Mikkelson Debora Renee
Bought by
Eisinger Abigail Peterson and Eisinger Dax Michael
Current Estimated Value
Home Financials for this Owner
Home Financials are based on the most recent Mortgage that was taken out on this home.
Original Mortgage
$409,849
Outstanding Balance
$366,368
Interest Rate
2.8%
Mortgage Type
New Conventional
Estimated Equity
$243,350
Purchase Details
Closed on
Jun 29, 2017
Sold by
Adams Kyle D
Bought by
Mikkelson Debora Renee
Home Financials for this Owner
Home Financials are based on the most recent Mortgage that was taken out on this home.
Original Mortgage
$225,000
Interest Rate
4.02%
Mortgage Type
New Conventional
Purchase Details
Closed on
May 30, 2014
Sold by
Fieldstone Utah Investors Llc
Bought by
Adams Kyle D
Home Financials for this Owner
Home Financials are based on the most recent Mortgage that was taken out on this home.
Original Mortgage
$240,250
Interest Rate
4.23%
Mortgage Type
New Conventional
Create a Home Valuation Report for This Property
The Home Valuation Report is an in-depth analysis detailing your home's value as well as a comparison with similar homes in the area
Home Values in the Area
Average Home Value in this Area
Purchase History
| Date | Buyer | Sale Price | Title Company |
|---|---|---|---|
| Eisinger Abigail Peterson | -- | Title One | |
| Mikkelson Debora Renee | -- | Inwest Title Svcs Ogden | |
| Adams Kyle D | -- | Bartlett Title Ins Agcy |
Source: Public Records
Mortgage History
| Date | Status | Borrower | Loan Amount |
|---|---|---|---|
| Open | Eisinger Abigail Peterson | $409,849 | |
| Previous Owner | Mikkelson Debora Renee | $225,000 | |
| Previous Owner | Adams Kyle D | $240,250 |
Source: Public Records
Tax History Compared to Growth
Tax History
| Year | Tax Paid | Tax Assessment Tax Assessment Total Assessment is a certain percentage of the fair market value that is determined by local assessors to be the total taxable value of land and additions on the property. | Land | Improvement |
|---|---|---|---|---|
| 2025 | $2,667 | $558,700 | $138,600 | $420,100 |
| 2024 | $2,667 | $545,500 | $111,100 | $434,400 |
| 2023 | $2,667 | $511,300 | $104,700 | $406,600 |
| 2022 | $3,002 | $523,200 | $102,700 | $420,500 |
| 2021 | $2,447 | $398,100 | $88,500 | $309,600 |
| 2020 | $2,566 | $355,100 | $88,500 | $266,600 |
| 2019 | $2,517 | $353,500 | $88,500 | $265,000 |
| 2018 | $2,108 | $322,900 | $73,800 | $249,100 |
| 2017 | $2,063 | $302,200 | $73,800 | $228,400 |
| 2016 | $1,903 | $276,300 | $79,200 | $197,100 |
| 2015 | $1,787 | $252,700 | $93,200 | $159,500 |
Source: Public Records
Map
Nearby Homes
- 15207 S Dirks Bay
- 15176 S Battle Dr
- 15344 S Oriskany Ln
- 1023 W Molly Pitcher Cir
- 915 W Mckenna Rd
- 15413 S Navy Trails Ln
- 981 W Cyan Valley Way
- 15319 S Park Bluff Way
- 15434 S Navy Trails Ln
- 951 W Cushing Rd
- 15436 W Navy Ln S
- 15144 S Bright Stars Dr
- 15088 S Cantle Dr
- 15091 S Reins Way
- 15098 S Bright Stars Dr
- 1097 W Coyote Gulch Way
- 15135 S Reins Way Unit 680
- 15461 S Midnight View Way
- 1107 W Coyote Gulch Way
- 15081 S Halter Way
- 15160 S Revolution Ln
- 15143 S Boston Harbor Ln Unit LOT418
- 15149 S Boston Harbor Ln
- 15157 S Revolution Ln
- 15157 S Revolution Ln Unit LOT424
- 15163 S Revolution Ln
- 15166 S Revolution Ln
- 15155 S Boston Harbor Ln
- 15131 S Honor Dr
- 15169 S Revolution Ln
- 15168 Amber Wave Dr
- 15142 S Boston Harbor Ln
- 15148 Boston Harbor Ln
- 15172 S Amber Wave Dr Unit LOT402
- 15169 S Gunpowder Ct
- 15152 S Peace Dr
- 15180 S Sabre Place
- 15125 S Honor Dr
- 15154 S Boston Harbor Ln
- 15178 S Amber Wave Dr