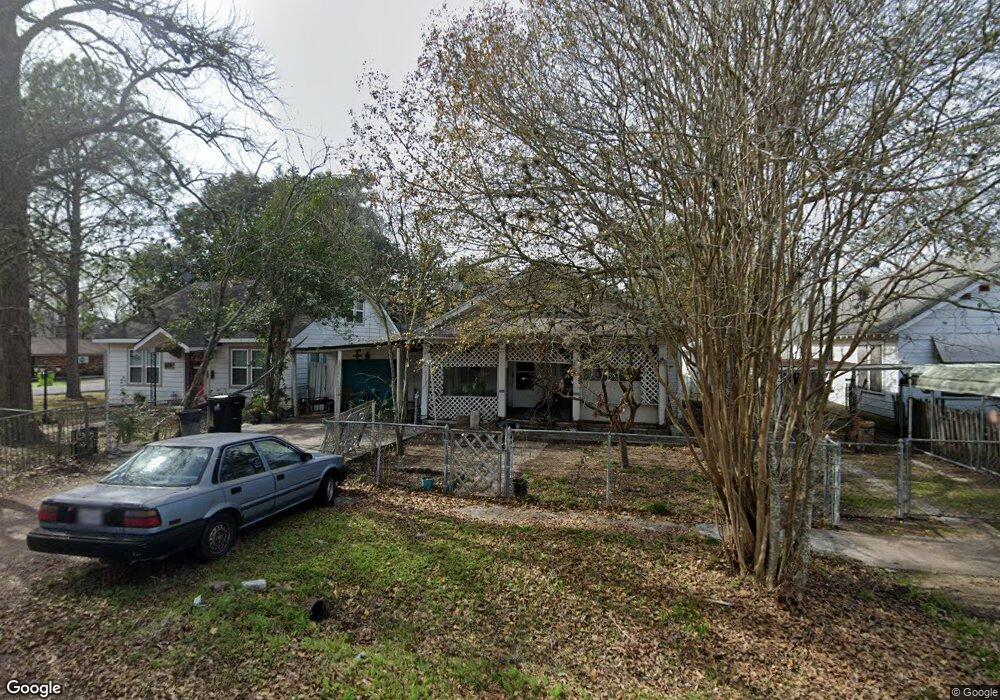
1516 7th St Rosenberg, TX 77471
Estimated Value: $163,546 - $199,000
1
Bed
1
Bath
864
Sq Ft
$210/Sq Ft
Est. Value
About This Home
This home is located at 1516 7th St, Rosenberg, TX 77471 and is currently estimated at $181,515, approximately $210 per square foot. 1516 7th St is a home located in Fort Bend County with nearby schools including Taylor Ray Elementary School, Navarro Middle School, and George Junior High School.
Ownership History
Date
Name
Owned For
Owner Type
Purchase Details
Closed on
Dec 28, 2012
Sold by
Olngieon Envingarta
Bought by
Dlorean Benlinda Yrene
Current Estimated Value
Purchase Details
Closed on
Dec 27, 2012
Sold by
Gceteam Llc
Bought by
Obregon Enriqueta
Purchase Details
Closed on
Dec 4, 2012
Sold by
Herrera Jesse R and Obregon Enriqueta S
Bought by
Gce Teal Llc
Purchase Details
Closed on
Dec 3, 2012
Sold by
Herrera Jesse R and Obregon Enriqueta S
Bought by
Gce Teal Llc
Purchase Details
Closed on
Jul 8, 2003
Sold by
Herrera Jesse R
Bought by
Obregon Enriqueta S
Purchase Details
Closed on
Sep 3, 1997
Sold by
Baca Daniel J
Bought by
Herrera Jesse R
Create a Home Valuation Report for This Property
The Home Valuation Report is an in-depth analysis detailing your home's value as well as a comparison with similar homes in the area
Home Values in the Area
Average Home Value in this Area
Purchase History
| Date | Buyer | Sale Price | Title Company |
|---|---|---|---|
| Dlorean Benlinda Yrene | -- | None Available | |
| Obregon Enriqueta | -- | None Available | |
| Gce Teal Llc | $5,107 | None Available | |
| Gce Teal Llc | $5,107 | None Available | |
| Obregon Enriqueta S | -- | -- | |
| Herrera Jesse R | -- | -- |
Source: Public Records
Tax History Compared to Growth
Tax History
| Year | Tax Paid | Tax Assessment Tax Assessment Total Assessment is a certain percentage of the fair market value that is determined by local assessors to be the total taxable value of land and additions on the property. | Land | Improvement |
|---|---|---|---|---|
| 2025 | $3,590 | $165,333 | $61,534 | $103,799 |
| 2024 | $3,590 | $190,070 | $61,534 | $128,536 |
| 2023 | $3,587 | $185,785 | $47,701 | $138,084 |
| 2022 | $3,185 | $155,490 | $47,700 | $107,790 |
| 2021 | $2,319 | $111,750 | $43,520 | $68,230 |
| 2020 | $2,367 | $111,510 | $42,920 | $68,590 |
| 2019 | $2,152 | $94,200 | $26,150 | $68,050 |
| 2018 | $1,904 | $82,050 | $26,150 | $55,900 |
| 2017 | $1,705 | $73,030 | $26,150 | $46,880 |
| 2016 | $1,364 | $58,420 | $26,150 | $32,270 |
| 2015 | $1,381 | $58,850 | $26,150 | $32,700 |
| 2014 | $1,369 | $57,630 | $26,150 | $31,480 |
Source: Public Records
Map
Nearby Homes