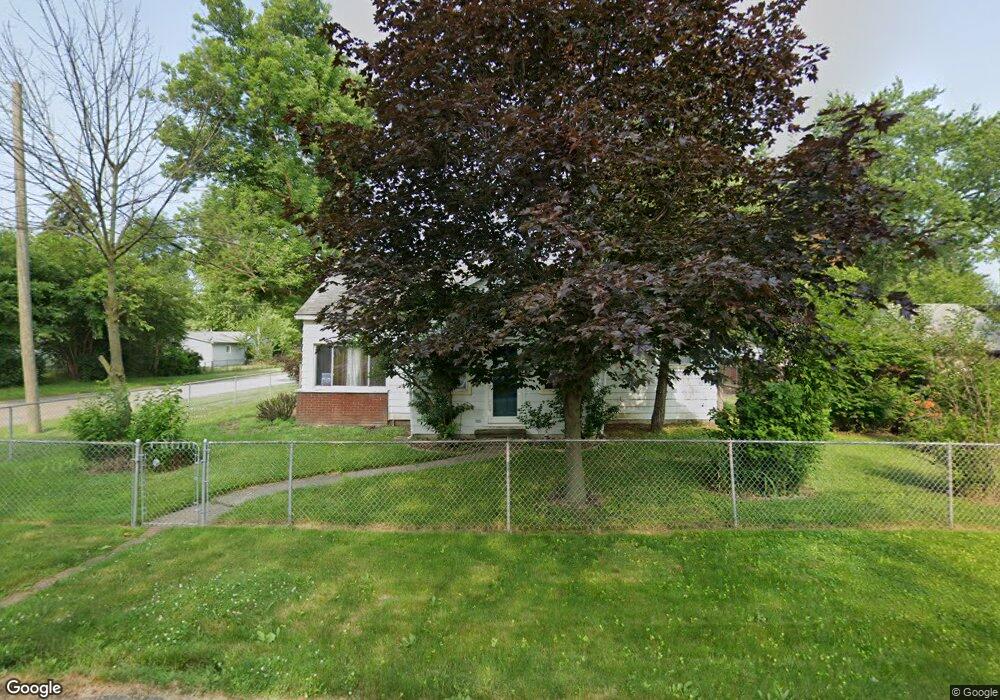
1516 Lillian St Westland, MI 48186
Estimated Value: $162,000 - $200,000
3
Beds
1
Bath
1,250
Sq Ft
$147/Sq Ft
Est. Value
About This Home
This home is located at 1516 Lillian St, Westland, MI 48186 and is currently estimated at $183,498, approximately $146 per square foot. 1516 Lillian St is a home located in Wayne County with nearby schools including Eugene B. Elliott Elementary School, Adams Middle School, and Benjamin Franklin Middle School.
Ownership History
Date
Name
Owned For
Owner Type
Purchase Details
Closed on
Sep 20, 2011
Sold by
Parascandalo April Diane
Bought by
Westerlund Richard Lee and Westerlund Patricia Ann
Current Estimated Value
Purchase Details
Closed on
Jul 27, 2011
Sold by
Parascandalo April Diane and Westerlund Richard Lee
Bought by
Parascandalo April Diane and Westerlund Richard Lee
Purchase Details
Closed on
Jul 20, 2011
Sold by
Parascandalo April Diane
Bought by
Parascandalo April Diane and Westerlund Richard Lee
Purchase Details
Closed on
Oct 15, 2008
Sold by
Crosslin Michael Franklin
Bought by
Parascandalo April Diane
Purchase Details
Closed on
Oct 17, 2007
Sold by
Flaskamp Laura C
Bought by
Federal National Mortgage Association
Purchase Details
Closed on
Apr 10, 2005
Sold by
Flaskamp Laura C
Bought by
Flaskamp Laura C and The Laura C Flaskamp Trust
Purchase Details
Closed on
Apr 1, 1998
Sold by
Connie Quijano Pr Shrf
Bought by
Bank United
Create a Home Valuation Report for This Property
The Home Valuation Report is an in-depth analysis detailing your home's value as well as a comparison with similar homes in the area
Home Values in the Area
Average Home Value in this Area
Purchase History
| Date | Buyer | Sale Price | Title Company |
|---|---|---|---|
| Westerlund Richard Lee | -- | None Available | |
| Parascandalo April Diane | -- | None Available | |
| Parascandalo April Diane | -- | None Available | |
| Parascandalo April Diane | -- | None Available | |
| Federal National Mortgage Association | $98,126 | None Available | |
| Flaskamp Laura C | -- | -- | |
| Bank United | $55,463 | -- |
Source: Public Records
Tax History Compared to Growth
Tax History
| Year | Tax Paid | Tax Assessment Tax Assessment Total Assessment is a certain percentage of the fair market value that is determined by local assessors to be the total taxable value of land and additions on the property. | Land | Improvement |
|---|---|---|---|---|
| 2025 | $1,468 | $83,700 | $0 | $0 |
| 2024 | $1,468 | $69,900 | $0 | $0 |
| 2023 | $1,402 | $63,500 | $0 | $0 |
| 2022 | $1,663 | $58,600 | $0 | $0 |
| 2021 | $1,621 | $56,000 | $0 | $0 |
| 2020 | $1,603 | $47,100 | $0 | $0 |
| 2019 | $1,546 | $40,100 | $0 | $0 |
| 2018 | $2,841 | $33,800 | $0 | $0 |
| 2017 | $592 | $33,000 | $0 | $0 |
| 2016 | $1,473 | $33,100 | $0 | $0 |
| 2015 | $2,802 | $28,660 | $0 | $0 |
| 2013 | $3,028 | $31,330 | $0 | $0 |
| 2012 | $1,508 | $30,860 | $0 | $0 |
Source: Public Records
Map
Nearby Homes
- 1682 Beatrice St
- 31842 Bay Ct
- 31820 Bay Ct
- 31784 Arenac Ct
- 32046 Cheboygan Ct
- 31923 Calhoun Ct
- 32155 Melton St
- 32116 Palmer Rd
- 32154 Melton St
- 32140 Palmer Rd
- 30828 Parkwood St
- 30779 Middlebury St
- 30805 Parkwood St
- 31606 Fairchild St
- 31913 Roscommon St
- 32332 Kalamazoo Ct
- 32025 Birchwood St
- 31203 Birchwood St
- 32111 Birchwood Ave
- 1351 Mar Ann Dr
- 47915 Barrington St
- 47870 Barrington St
- 47780 Barrington St
- 47901 Barrington St
- 47826 Barrington St
- 47814 Barrington St
- 47819 Barrington St
- 48048 Barrington St
- 1517 Elias St
- 1485 Elias St
- 1507 Elias St
- 1517 Lillian St
- 1482 Lillian St
- 1497 Lillian St
- 1485 Lillian St
- 1611 Elias St
- 1620 Lillian St
- 1611 Lillian St
- 1473 Lillian St
- 1623 Elias St