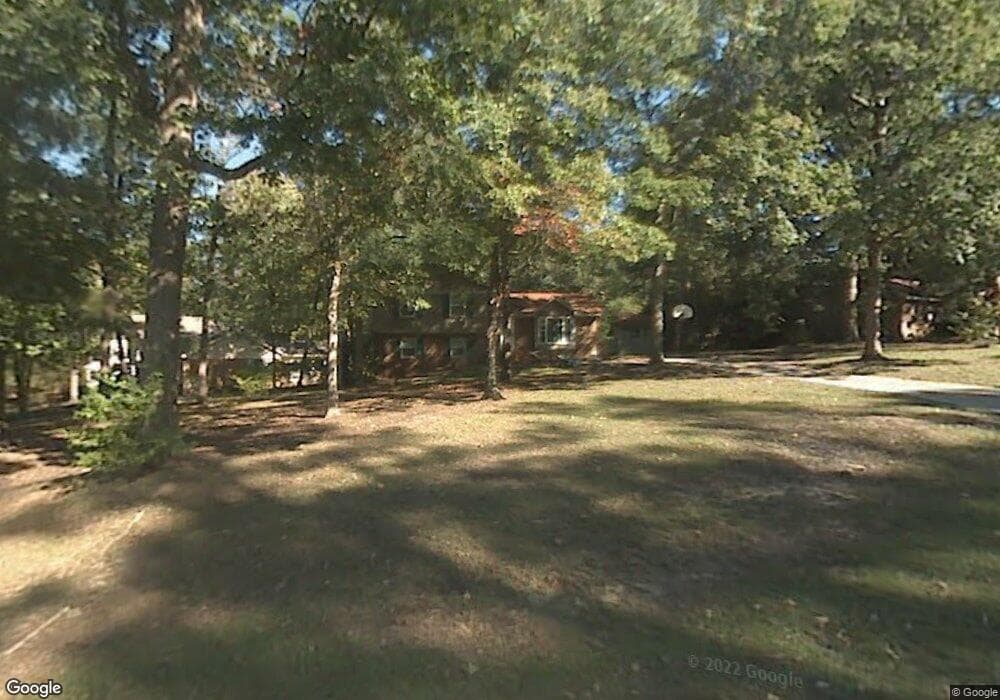
1516 Owls Nest Rd Sanford, NC 27330
Estimated Value: $318,000 - $364,000
4
Beds
3
Baths
2,004
Sq Ft
$167/Sq Ft
Est. Value
About This Home
This home is located at 1516 Owls Nest Rd, Sanford, NC 27330 and is currently estimated at $334,578, approximately $166 per square foot. 1516 Owls Nest Rd is a home located in Lee County with nearby schools including J.R. Ingram Jr. Elementary School, West Lee Middle School, and Southern Lee High School.
Ownership History
Date
Name
Owned For
Owner Type
Purchase Details
Closed on
Mar 12, 2009
Sold by
Durst Kristine L and Durst Dale W
Bought by
Bauer Louis E and Bauer Amy S
Current Estimated Value
Home Financials for this Owner
Home Financials are based on the most recent Mortgage that was taken out on this home.
Original Mortgage
$131,500
Outstanding Balance
$83,660
Interest Rate
5.14%
Mortgage Type
New Conventional
Estimated Equity
$250,918
Purchase Details
Closed on
Jun 14, 2005
Sold by
Vincentsen David Martin and Vincentsen Kimberly A
Bought by
Durst Kristine L and Durst Dale W
Home Financials for this Owner
Home Financials are based on the most recent Mortgage that was taken out on this home.
Original Mortgage
$107,120
Interest Rate
5.69%
Mortgage Type
New Conventional
Purchase Details
Closed on
Dec 3, 2001
Sold by
Stack Robert D
Bought by
Vincentsen David Martin
Create a Home Valuation Report for This Property
The Home Valuation Report is an in-depth analysis detailing your home's value as well as a comparison with similar homes in the area
Home Values in the Area
Average Home Value in this Area
Purchase History
| Date | Buyer | Sale Price | Title Company |
|---|---|---|---|
| Bauer Louis E | $143,500 | -- | |
| Durst Kristine L | $134,000 | None Available | |
| Vincentsen David Martin | $127,500 | -- |
Source: Public Records
Mortgage History
| Date | Status | Borrower | Loan Amount |
|---|---|---|---|
| Open | Bauer Louis E | $131,500 | |
| Previous Owner | Durst Kristine L | $107,120 |
Source: Public Records
Tax History Compared to Growth
Tax History
| Year | Tax Paid | Tax Assessment Tax Assessment Total Assessment is a certain percentage of the fair market value that is determined by local assessors to be the total taxable value of land and additions on the property. | Land | Improvement |
|---|---|---|---|---|
| 2025 | $3,206 | $239,300 | $35,000 | $204,300 |
| 2024 | $3,186 | $239,300 | $35,000 | $204,300 |
| 2023 | $3,176 | $239,300 | $35,000 | $204,300 |
| 2022 | $2,287 | $145,700 | $30,000 | $115,700 |
| 2021 | $2,321 | $145,700 | $30,000 | $115,700 |
| 2020 | $2,313 | $145,700 | $30,000 | $115,700 |
| 2019 | $2,273 | $145,700 | $30,000 | $115,700 |
| 2018 | $2,212 | $140,400 | $25,000 | $115,400 |
| 2017 | $2,184 | $140,400 | $25,000 | $115,400 |
| 2016 | $2,159 | $140,400 | $25,000 | $115,400 |
| 2014 | $2,053 | $140,400 | $25,000 | $115,400 |
Source: Public Records
Map
Nearby Homes
- 0 Pendergrass Rd Unit 701808
- 2017 Owls Nest Rd
- 1508 Westfall Cir
- 1700 Phillips Dr
- 2101 Wimberly Woods Dr
- 0 Phillips Dr Unit 10088155
- 3309 Westcott Cir
- 729 Richardson Dr
- 5224 Tyndall Dr
- 5228 Tyndall Dr
- 5232 Tyndall Dr
- 5220 Tyndall Dr
- 737 Richardson Dr
- 5058 Tyndall Dr
- 5054 Tyndall Dr
- 5216 Tyndall Dr
- 5212 Tyndall Dr
- Freelance Plan at Brantley Place
- Intrigue Plan at Brantley Place
- Prelude Plan at Brantley Place
- 1512 Owls Nest Rd
- 1604 Owls Nest Rd
- 1608 Owls Nest Rd
- 1508 Owls Nest Rd
- 4616 Kimberly Cir
- 1517 Owls Nest Rd
- 1612 Owls Nest Rd
- 1504 Owls Nest Rd
- 4620 Kimberly Cir
- 1601 Owls Nest Rd
- 1605 Owls Nest Rd
- 4612 Kimberly Cir
- 1505 Owls Nest Rd
- 1609 Owls Nest Rd
- 1500 Owls Nest Rd
- 1616 Owls Nest Rd
- 1409 Pendergrass Rd
- 1613 Owls Nest Rd
- 1405 Pendergrass Rd
- 4617 Kimberly Cir