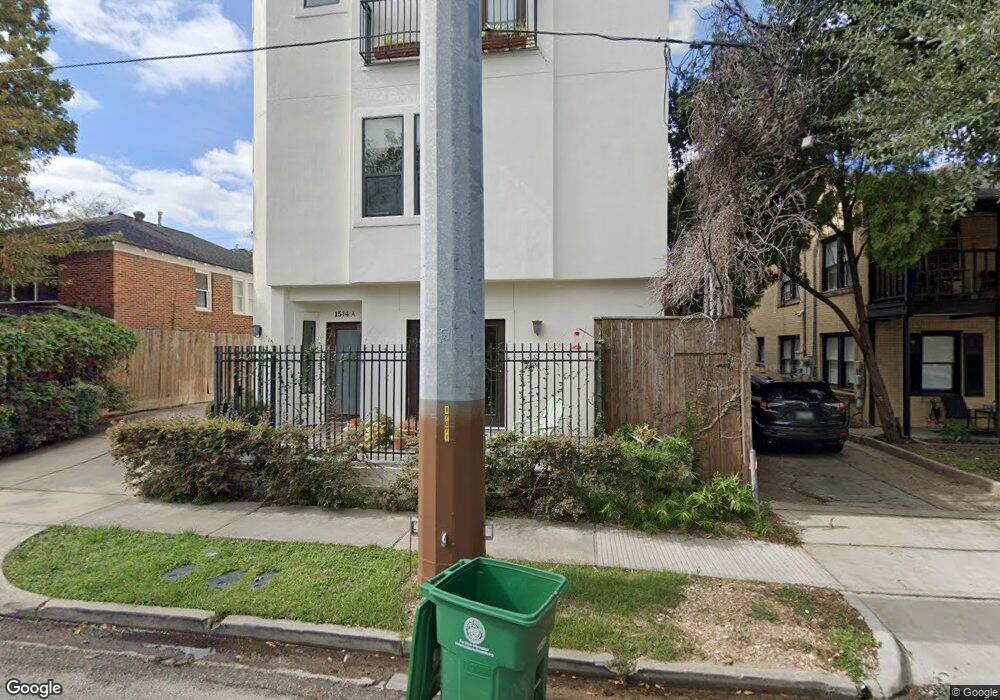
1516 Ridgewood St Unit LOWER Houston, TX 77006
Montrose NeighborhoodEstimated Value: $606,041 - $666,000
2
Beds
1
Bath
2,403
Sq Ft
$267/Sq Ft
Est. Value
About This Home
This home is located at 1516 Ridgewood St Unit LOWER, Houston, TX 77006 and is currently estimated at $641,260, approximately $266 per square foot. 1516 Ridgewood St Unit LOWER is a home located in Harris County with nearby schools including Baker Montessori, Lanier Middle School, and Lamar High School.
Ownership History
Date
Name
Owned For
Owner Type
Purchase Details
Closed on
Dec 22, 2021
Sold by
Ogonosky James R and Ogonosky Andrea B
Bought by
Moore Vincent A
Current Estimated Value
Home Financials for this Owner
Home Financials are based on the most recent Mortgage that was taken out on this home.
Original Mortgage
$520,000
Outstanding Balance
$477,425
Interest Rate
2.98%
Mortgage Type
New Conventional
Estimated Equity
$163,835
Purchase Details
Closed on
May 29, 2012
Sold by
Villa Pella Inc
Bought by
Ogonosky James R and Ogonosky Andrea B
Home Financials for this Owner
Home Financials are based on the most recent Mortgage that was taken out on this home.
Original Mortgage
$367,200
Interest Rate
3.93%
Mortgage Type
New Conventional
Purchase Details
Closed on
Aug 9, 2006
Sold by
Drori Shy
Bought by
Villa Bella Inc
Create a Home Valuation Report for This Property
The Home Valuation Report is an in-depth analysis detailing your home's value as well as a comparison with similar homes in the area
Home Values in the Area
Average Home Value in this Area
Purchase History
| Date | Buyer | Sale Price | Title Company |
|---|---|---|---|
| Moore Vincent A | -- | Riverway Title Company | |
| Moore Vincent A | -- | Riverway Title Company | |
| Ogonosky James R | -- | Old Republic National Ins Co | |
| Villa Bella Inc | -- | Houston Title Co |
Source: Public Records
Mortgage History
| Date | Status | Borrower | Loan Amount |
|---|---|---|---|
| Open | Moore Vincent A | $520,000 | |
| Closed | Moore Vincent A | $520,000 | |
| Previous Owner | Ogonosky James R | $367,200 |
Source: Public Records
Tax History Compared to Growth
Tax History
| Year | Tax Paid | Tax Assessment Tax Assessment Total Assessment is a certain percentage of the fair market value that is determined by local assessors to be the total taxable value of land and additions on the property. | Land | Improvement |
|---|---|---|---|---|
| 2025 | $9,060 | $600,000 | $164,230 | $435,770 |
| 2024 | $9,060 | $592,117 | $164,230 | $427,887 |
| 2023 | $9,060 | $545,000 | $164,230 | $380,770 |
| 2022 | $11,834 | $537,440 | $164,230 | $373,210 |
| 2021 | $11,825 | $507,381 | $156,765 | $350,616 |
| 2020 | $12,331 | $509,230 | $156,765 | $352,465 |
| 2019 | $14,659 | $579,288 | $133,773 | $445,515 |
| 2018 | $14,268 | $563,859 | $133,773 | $430,086 |
| 2017 | $14,962 | $563,859 | $125,412 | $438,447 |
| 2016 | $14,962 | $563,859 | $125,412 | $438,447 |
| 2015 | $12,684 | $531,000 | $108,690 | $422,310 |
| 2014 | $12,684 | $493,397 | $83,608 | $409,789 |
Source: Public Records
Map
Nearby Homes
- 1609 Peden St
- 1804 Haddon St
- 1545 Haddon St
- 1705 Park St
- 1541 Nevada St
- 1914 W Gray St Unit 301
- 1611 Vermont St
- 1515 Vermont St Unit D
- 1511 Vermont St Unit A
- 1509 Vermont St Unit D
- 1524 Welch St
- 1503 Vermont St Unit D
- 1503 Vermont St Unit A
- 1503 Vermont St Unit C
- 1529 Welch St
- 1603 & 1607 Welch St
- 1902 Elmen St
- 1935 W Clay St
- 1937 W Clay St
- 1510 Morse St
- 1516 Ridgewood St
- 1518 Ridgewood St
- 1518 Ridgewood St Unit 1520
- 1512 Ridgewood St
- 1515 Dunlavy St
- 1514 Ridgewood St Unit C
- 1514 Ridgewood St Unit B
- 1514 Ridgewood St Unit A
- 1514 Ridgewood St
- 1513 Dunlavy St
- 1519 Dunlavy St
- 1511 Dunlavy St
- 1510 1/2 Ridgewood St
- 1510 Ridgewood St
- 1524 Ridgewood St
- 1524 Ridgewood St Unit 1
- 1524 Ridgewood St Unit 2
- 1508 Ridgewood St
- 1508 Ridgewood St Unit 1506
- 1506 Ridgewood St