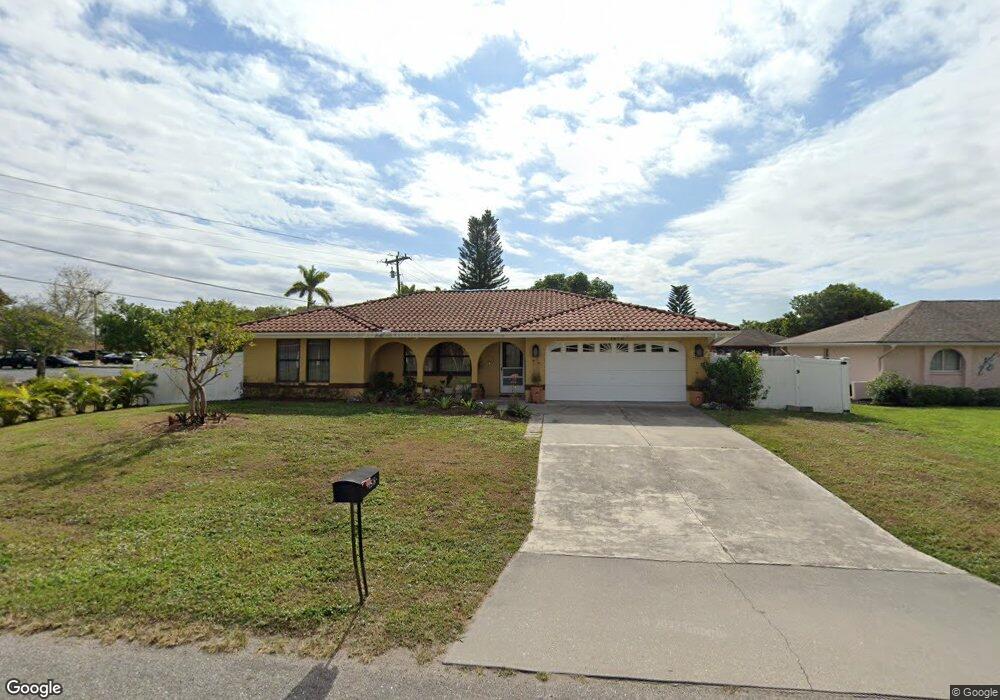
1516 SE 17th St Unit 45 Cape Coral, FL 33990
Hancock NeighborhoodEstimated Value: $301,348 - $424,000
3
Beds
2
Baths
1,515
Sq Ft
$224/Sq Ft
Est. Value
About This Home
This home is located at 1516 SE 17th St Unit 45, Cape Coral, FL 33990 and is currently estimated at $339,337, approximately $223 per square foot. 1516 SE 17th St Unit 45 is a home located in Lee County with nearby schools including Caloosa Elementary School, Cape Elementary School, and Tropic Isles Elementary School.
Ownership History
Date
Name
Owned For
Owner Type
Purchase Details
Closed on
Feb 13, 2025
Sold by
Joseph Nancy
Bought by
Wilson Laritza Sabo and Guardia Hector Carlos
Current Estimated Value
Home Financials for this Owner
Home Financials are based on the most recent Mortgage that was taken out on this home.
Original Mortgage
$323,040
Outstanding Balance
$320,217
Interest Rate
7.04%
Mortgage Type
FHA
Estimated Equity
$19,120
Purchase Details
Closed on
Jan 18, 2016
Sold by
Freeman James Albert
Bought by
Joseph Nancy
Purchase Details
Closed on
Mar 6, 2002
Sold by
Freeman James A and Freeman Gladys G
Bought by
Freeman James A
Purchase Details
Closed on
Aug 30, 1996
Sold by
Pozo Antinogeno and Pozo Antinogenos
Bought by
Acosta Nelson E
Home Financials for this Owner
Home Financials are based on the most recent Mortgage that was taken out on this home.
Original Mortgage
$76,278
Interest Rate
8.17%
Mortgage Type
FHA
Create a Home Valuation Report for This Property
The Home Valuation Report is an in-depth analysis detailing your home's value as well as a comparison with similar homes in the area
Home Values in the Area
Average Home Value in this Area
Purchase History
| Date | Buyer | Sale Price | Title Company |
|---|---|---|---|
| Wilson Laritza Sabo | $329,000 | Estates Title | |
| Joseph Nancy | $115,000 | Attorney | |
| Freeman James A | -- | -- | |
| Acosta Nelson E | $78,000 | -- |
Source: Public Records
Mortgage History
| Date | Status | Borrower | Loan Amount |
|---|---|---|---|
| Open | Wilson Laritza Sabo | $323,040 | |
| Previous Owner | Acosta Nelson E | $76,278 |
Source: Public Records
Tax History Compared to Growth
Tax History
| Year | Tax Paid | Tax Assessment Tax Assessment Total Assessment is a certain percentage of the fair market value that is determined by local assessors to be the total taxable value of land and additions on the property. | Land | Improvement |
|---|---|---|---|---|
| 2025 | $2,763 | $165,354 | -- | -- |
| 2024 | $2,763 | $160,694 | -- | -- |
| 2023 | $2,631 | $156,014 | $0 | $0 |
| 2022 | $2,423 | $151,470 | $0 | $0 |
| 2021 | $2,427 | $159,487 | $38,932 | $120,555 |
| 2020 | $2,342 | $139,609 | $0 | $0 |
| 2019 | $2,262 | $136,470 | $22,500 | $113,970 |
| 2018 | $2,290 | $136,466 | $22,500 | $113,966 |
| 2017 | $2,386 | $139,708 | $15,300 | $124,408 |
| 2016 | $2,721 | $117,456 | $15,300 | $102,156 |
| 2015 | $2,466 | $103,104 | $12,600 | $90,504 |
| 2014 | $2,431 | $100,993 | $10,152 | $90,841 |
| 2013 | -- | $89,798 | $10,800 | $78,998 |
Source: Public Records
Map
Nearby Homes
- 1447 SE 17th Terrace
- 1512 SE 17th Terrace
- 1439 SE 18th St
- 1449 SE 16th St
- 1806 SE 15th Place
- 1405 SE 17th St
- 1453 SE 15th Terrace
- 1902 SE 15th Place
- 1658 Coral Point Dr
- 1433 SE 19th Terrace
- 1404 SE 15th St
- 1314 SE 15th Terrace
- 1727 SE 16th St Unit Lot 21
- 1421 SE 14th Terrace
- 1222 SE 18th Terrace
- 1705 SE 19th Ln
- 1773 Four Mile Cove Pkwy Unit 1123
- 1781 Coral Point Dr
- 1804 Coral Point Dr Unit 32
- 1516 SE 20th St
- 1512 SE 17th St
- 1517 SE 17th Terrace
- 1513 SE 17th Terrace
- 1508 SE 17th St
- 1515 SE 17th St
- 1519 SE 17th St
- 1511 SE 17th St
- 1525 SE 17th St
- 1504 SE 17th St
- 1507 SE 17th St
- 1505 SE 17th Terrace
- 1720 SE 15th Place
- 1503 SE 17th St
- 1446 SE 17th St
- 1508 SE 17th Terrace
- 1445 SE 17th St
- 1714 SE Santa Barbara Place Unit 16
- 1714 SE Santa Barbara Place Unit 1716
- 1714 SE Santa Barbara Place
- 1442 SE 17th St