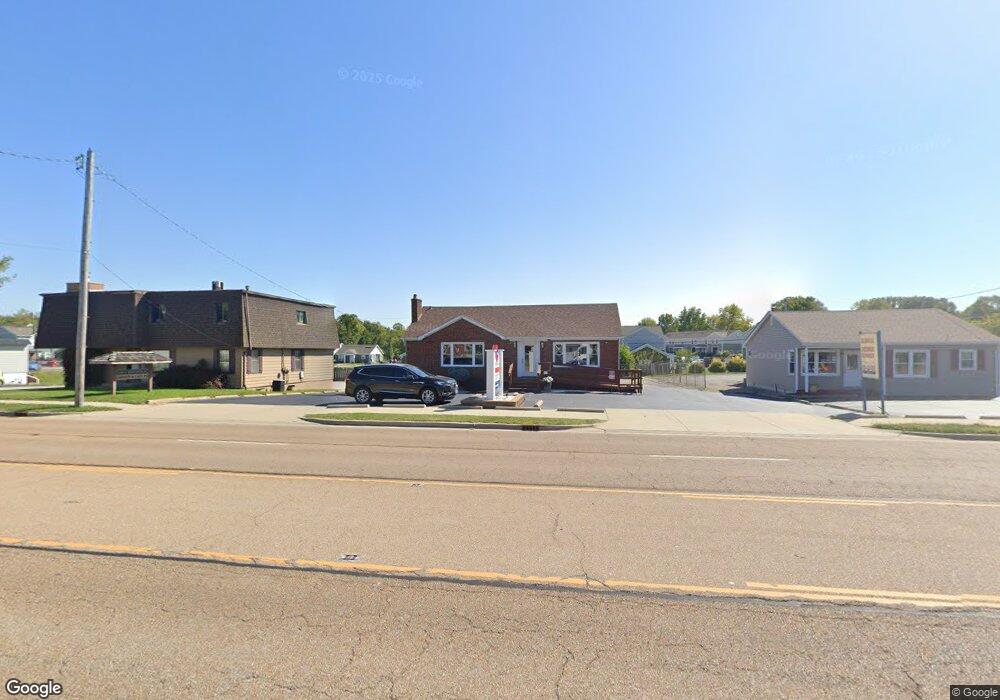
1516 Vandalia St Collinsville, IL 62234
Estimated Value: $246,764
--
Bed
--
Bath
1,926
Sq Ft
$128/Sq Ft
Est. Value
About This Home
This home is located at 1516 Vandalia St, Collinsville, IL 62234 and is currently estimated at $246,764, approximately $128 per square foot. 1516 Vandalia St is a home located in Madison County with nearby schools including John A Renfro Elementary School, Dorris Intermediate School, and Collinsville Middle School.
Ownership History
Date
Name
Owned For
Owner Type
Purchase Details
Closed on
Jul 20, 2020
Sold by
Niedringhaus Tiffany
Bought by
Niedringhaus Richard
Current Estimated Value
Purchase Details
Closed on
Feb 24, 2012
Sold by
Tlm Vv Minh Tam
Bought by
Thi Vv Minh Tam and Truong Minh Avang
Purchase Details
Closed on
Jul 31, 2007
Sold by
Truong Minh Q and Truong Natasha
Bought by
Vu Minhtam Thi
Purchase Details
Closed on
Oct 3, 2006
Sold by
Vu Minhtam Thi
Bought by
Truong Minh Q and Truong Natasha
Purchase Details
Closed on
Feb 23, 2004
Sold by
Eilering Richard L and Smith Bradford B
Bought by
Vu Minhtam Thi
Home Financials for this Owner
Home Financials are based on the most recent Mortgage that was taken out on this home.
Original Mortgage
$60,000
Interest Rate
6.25%
Mortgage Type
Commercial
Create a Home Valuation Report for This Property
The Home Valuation Report is an in-depth analysis detailing your home's value as well as a comparison with similar homes in the area
Home Values in the Area
Average Home Value in this Area
Purchase History
| Date | Buyer | Sale Price | Title Company |
|---|---|---|---|
| Niedringhaus Richard | -- | None Available | |
| Thi Vv Minh Tam | -- | None Available | |
| Vu Minhtam Thi | -- | None Available | |
| Truong Minh Q | -- | None Available | |
| Vu Minhtam Thi | $128,000 | Abstracts & Titles Inc |
Source: Public Records
Mortgage History
| Date | Status | Borrower | Loan Amount |
|---|---|---|---|
| Previous Owner | Vu Minhtam Thi | $60,000 |
Source: Public Records
Tax History Compared to Growth
Tax History
| Year | Tax Paid | Tax Assessment Tax Assessment Total Assessment is a certain percentage of the fair market value that is determined by local assessors to be the total taxable value of land and additions on the property. | Land | Improvement |
|---|---|---|---|---|
| 2024 | $2,523 | $39,460 | $13,390 | $26,070 |
| 2023 | $2,523 | $36,520 | $12,390 | $24,130 |
| 2022 | $2,404 | $33,770 | $11,460 | $22,310 |
| 2021 | $2,275 | $32,930 | $10,860 | $22,070 |
| 2020 | $2,193 | $31,420 | $10,360 | $21,060 |
| 2019 | $2,135 | $30,350 | $10,010 | $20,340 |
| 2018 | $2,087 | $28,760 | $9,490 | $19,270 |
| 2017 | $2,091 | $28,190 | $9,300 | $18,890 |
| 2016 | $2,086 | $26,690 | $7,300 | $19,390 |
| 2015 | $2,223 | $26,000 | $7,110 | $18,890 |
| 2014 | $2,223 | $26,000 | $7,110 | $18,890 |
| 2013 | $2,223 | $26,000 | $7,110 | $18,890 |
Source: Public Records
Map
Nearby Homes
- 706 Illinois Ave
- 1227 Ridge Ave
- 102 Toni Ct
- 300 Pine Lake Rd Unit 6
- 300 Pine Lake Rd Unit 7
- 1002 California Ave
- 203 Greenfield Dr
- 892 Lester Ave
- 0 N Keebler Ave
- 1210 Constance St
- 1120 Williams St
- 1322 Leland St
- 2 Chelsea Rd
- 112 Crestmoor St
- 501 Spring
- 308 Brown Ave
- 1224 Cedar Ridge Ct
- 625 W Country Ln
- 919 Vine St
- 921 Prospect St
- 1600 Vandalia St
- 1602 Vandalia St
- 1509 Vandalia St
- 1609 Vandalia St
- 1610 Vandalia St
- 1507 Vandalia St
- 1611 Vandalia St
- 117 Mounds Ave
- 602 Kinloch Ave
- 118 Mounds Ave
- 1503 Vandalia St
- 606 Kinloch Ave
- 120 Mounds Ave
- 608 Kinloch Ave
- 121 Mounds Ave
- 610 Kinloch Ave
- 122 Mounds Ave
- 612 Kinloch Ave
- 123 Mounds Ave
- 614 Kinloch Ave