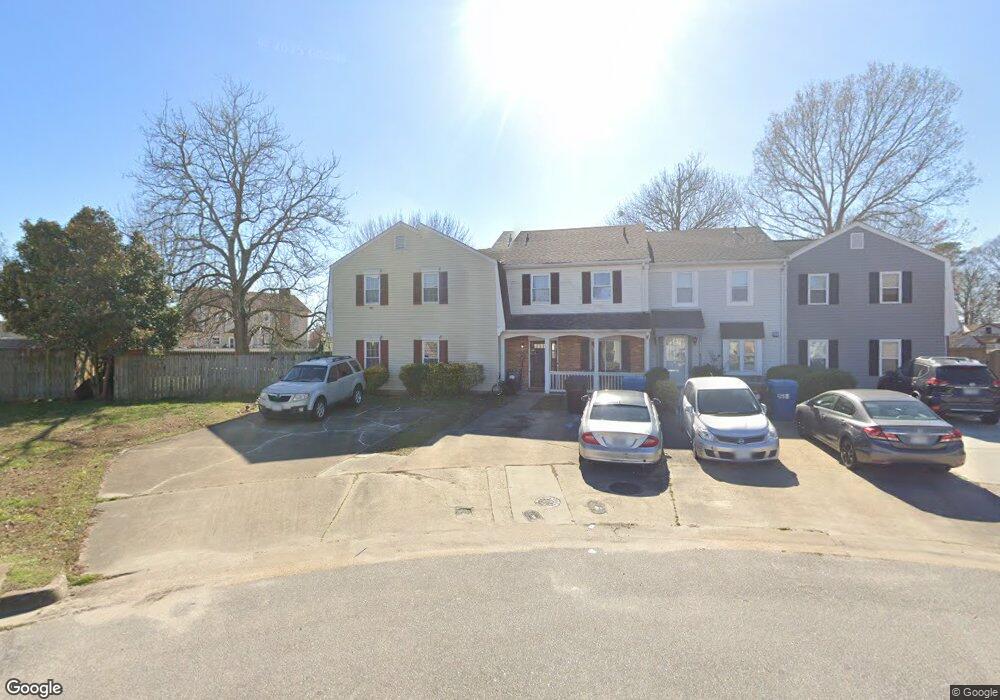
1517 Antler Cir Virginia Beach, VA 23464
Estimated Value: $299,000 - $312,689
3
Beds
3
Baths
1,760
Sq Ft
$175/Sq Ft
Est. Value
About This Home
This home is located at 1517 Antler Cir, Virginia Beach, VA 23464 and is currently estimated at $307,922, approximately $174 per square foot. 1517 Antler Cir is a home located in Virginia Beach City with nearby schools including Indian Lakes Elementary School, Salem Middle School, and Salem High School.
Ownership History
Date
Name
Owned For
Owner Type
Purchase Details
Closed on
Oct 22, 2020
Sold by
Yu Junge
Bought by
Giesler Joyce
Current Estimated Value
Home Financials for this Owner
Home Financials are based on the most recent Mortgage that was taken out on this home.
Original Mortgage
$212,578
Outstanding Balance
$188,732
Interest Rate
2.8%
Mortgage Type
FHA
Estimated Equity
$119,190
Purchase Details
Closed on
Jun 4, 2019
Sold by
Resseguie Chris
Bought by
Yu Junge
Home Financials for this Owner
Home Financials are based on the most recent Mortgage that was taken out on this home.
Original Mortgage
$191,020
Interest Rate
4.2%
Mortgage Type
VA
Purchase Details
Closed on
Nov 7, 2008
Sold by
Gilbert William J
Bought by
Resseguie Christopher B
Home Financials for this Owner
Home Financials are based on the most recent Mortgage that was taken out on this home.
Original Mortgage
$217,477
Interest Rate
6.13%
Mortgage Type
VA
Create a Home Valuation Report for This Property
The Home Valuation Report is an in-depth analysis detailing your home's value as well as a comparison with similar homes in the area
Home Values in the Area
Average Home Value in this Area
Purchase History
| Date | Buyer | Sale Price | Title Company |
|---|---|---|---|
| Giesler Joyce | $216,500 | Fidelity National Ttl Ins Co | |
| Yu Junge | $187,000 | Attorney | |
| Resseguie Christopher B | $212,900 | -- |
Source: Public Records
Mortgage History
| Date | Status | Borrower | Loan Amount |
|---|---|---|---|
| Open | Giesler Joyce | $212,578 | |
| Previous Owner | Yu Junge | $191,020 | |
| Previous Owner | Resseguie Christopher B | $217,477 |
Source: Public Records
Tax History Compared to Growth
Tax History
| Year | Tax Paid | Tax Assessment Tax Assessment Total Assessment is a certain percentage of the fair market value that is determined by local assessors to be the total taxable value of land and additions on the property. | Land | Improvement |
|---|---|---|---|---|
| 2025 | $2,537 | $291,100 | $81,000 | $210,100 |
| 2024 | $2,537 | $261,500 | $81,000 | $180,500 |
| 2023 | $2,420 | $244,400 | $78,100 | $166,300 |
| 2022 | $2,244 | $226,700 | $68,000 | $158,700 |
| 2021 | $1,984 | $200,400 | $59,000 | $141,400 |
| 2020 | $1,910 | $187,700 | $53,000 | $134,700 |
| 2019 | $1,786 | $170,100 | $50,000 | $120,100 |
| 2018 | $1,705 | $170,100 | $50,000 | $120,100 |
| 2017 | $1,648 | $164,400 | $48,000 | $116,400 |
| 2016 | $1,496 | $151,100 | $44,000 | $107,100 |
| 2015 | $1,417 | $143,100 | $44,000 | $99,100 |
| 2014 | $1,384 | $149,600 | $48,000 | $101,600 |
Source: Public Records
Map
Nearby Homes
- 4574 Greenlaw Dr
- 4587 Greenlaw Dr
- 1505 Hadley Ct
- 4706 Greenlaw Dr
- 1287 Bridle Creek Blvd
- 1612 Rodeo Dr
- 1224 Cherry Blossom Ct
- 4908 Hillswick Dr
- 1613 Cliffwood Dr
- 4905 Hillswick Dr
- 4972 Montrose Dr
- 1608 Notley Dr
- 5029 Hillswick Dr
- 4921 Ruth Rd
- 1221 Hartford Dr
- 5149 Rugby Rd
- 4764 Ardmore Ln
- 1220 Heathcliff Dr
- 1374 Orillia Rd
- 4748 Ardmore Ln
- 1515 Antler Cir
- 1513 Antler Cir
- 1508 Antler Cir
- 1511 Antler Cir
- 1506 Antler Cir
- 4744 Longmont Rd
- 1509 Antler Cir
- 1504 Antler Cir
- 1507 Antler Cir
- 1502 Antler Cir
- 1505 Antler Cir
- 4740 Longmont Rd
- 1503 Antler Cir
- 4556 Greenlaw Dr
- 4554 Greenlaw Dr
- 4558 Greenlaw Dr
- 1501 Antler Cir
- 4560 Greenlaw Dr
- 4562 Greenlaw Dr
- 4564 Greenlaw Dr