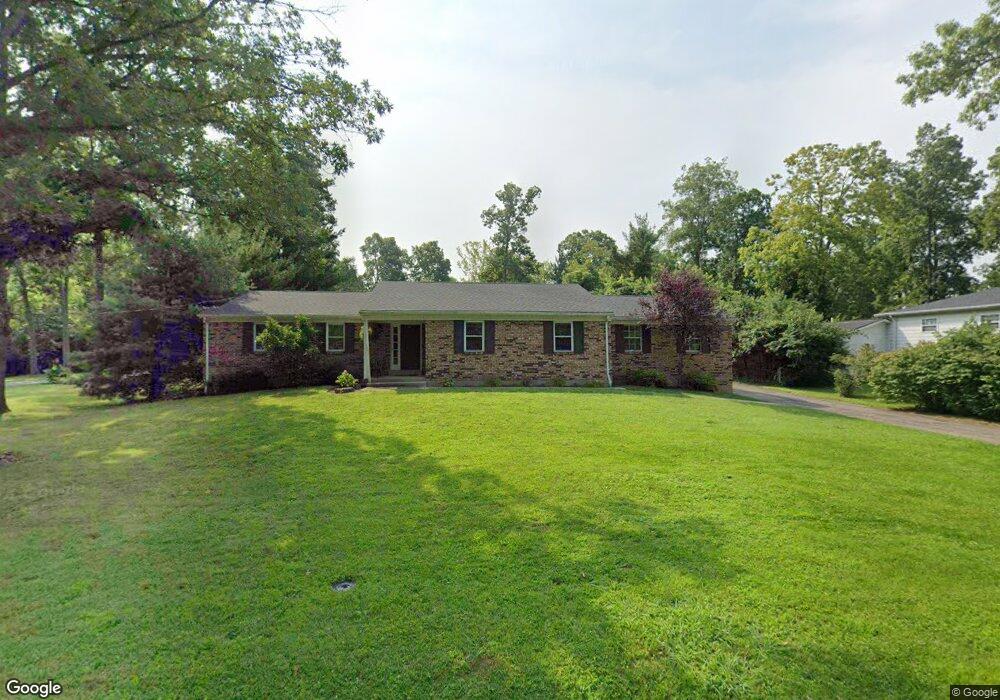
1517 Fay Rd Loveland, OH 45140
Estimated Value: $318,834 - $348,000
3
Beds
2
Baths
1,692
Sq Ft
$200/Sq Ft
Est. Value
About This Home
This home is located at 1517 Fay Rd, Loveland, OH 45140 and is currently estimated at $337,959, approximately $199 per square foot. 1517 Fay Rd is a home located in Clermont County with nearby schools including Marr/Cook Elementary School, Spaulding Elementary School, and Goshen Middle School.
Ownership History
Date
Name
Owned For
Owner Type
Purchase Details
Closed on
Apr 6, 2022
Sold by
Gary Wehrman
Bought by
Wehrman Gary and Weber Dawn C
Current Estimated Value
Purchase Details
Closed on
Oct 5, 2018
Sold by
Fry Holdings Llc
Bought by
Wehrman Gary
Home Financials for this Owner
Home Financials are based on the most recent Mortgage that was taken out on this home.
Original Mortgage
$193,431
Interest Rate
5.75%
Mortgage Type
FHA
Purchase Details
Closed on
Apr 19, 2018
Sold by
Fannie Mae
Bought by
Fry Holdings Llc
Purchase Details
Closed on
Aug 25, 2017
Sold by
U S Bank National Association
Bought by
Federal National Mortgage Association
Purchase Details
Closed on
Jul 11, 1995
Sold by
Lawrence Joan
Bought by
Larson Steven D and Larson Tina J
Home Financials for this Owner
Home Financials are based on the most recent Mortgage that was taken out on this home.
Original Mortgage
$109,100
Interest Rate
7.9%
Mortgage Type
New Conventional
Create a Home Valuation Report for This Property
The Home Valuation Report is an in-depth analysis detailing your home's value as well as a comparison with similar homes in the area
Home Values in the Area
Average Home Value in this Area
Purchase History
| Date | Buyer | Sale Price | Title Company |
|---|---|---|---|
| Wehrman Gary | -- | None Listed On Document | |
| Wehrman Gary | $197,000 | American Homeland Title | |
| Fry Holdings Llc | -- | Omega Title | |
| Federal National Mortgage Association | $127,100 | None Available | |
| Larson Steven D | $114,900 | -- |
Source: Public Records
Mortgage History
| Date | Status | Borrower | Loan Amount |
|---|---|---|---|
| Previous Owner | Wehrman Gary | $193,431 | |
| Previous Owner | Larson Steven D | $109,100 |
Source: Public Records
Tax History Compared to Growth
Tax History
| Year | Tax Paid | Tax Assessment Tax Assessment Total Assessment is a certain percentage of the fair market value that is determined by local assessors to be the total taxable value of land and additions on the property. | Land | Improvement |
|---|---|---|---|---|
| 2024 | $4,018 | $90,090 | $14,700 | $75,390 |
| 2023 | $3,894 | $90,090 | $14,700 | $75,390 |
| 2022 | $2,721 | $55,410 | $9,030 | $46,380 |
| 2021 | $2,737 | $55,410 | $9,030 | $46,380 |
| 2020 | $2,557 | $55,410 | $9,030 | $46,380 |
| 2019 | $2,917 | $60,660 | $8,720 | $51,940 |
| 2018 | $3,000 | $60,660 | $8,720 | $51,940 |
| 2017 | $2,932 | $60,660 | $8,720 | $51,940 |
| 2016 | $2,696 | $52,300 | $7,530 | $44,770 |
| 2015 | $2,433 | $52,300 | $7,530 | $44,770 |
| 2014 | $2,433 | $52,300 | $7,530 | $44,770 |
| 2013 | $2,231 | $50,060 | $7,530 | $42,530 |
Source: Public Records
Map
Nearby Homes
- 6637 Oakland Rd
- 3449 Belgian Cir
- 3424 Belgian Cir
- 3420 Belgian Cir
- 3445 Belgian Cir
- 3269 Thoroughbred Dr
- 3265 Thoroughbred Dr
- 5099 Charles Snider Rd
- 1480 Fay Rd Unit 202
- 1480 Fay Rd Unit 70
- 1480 Fay Rd Unit 28
- 1480 Fay Rd Unit 216
- 1480 Fay Rd Unit Lot 104
- 1480 Fay Rd Unit 34
- 1480 Fay Rd Unit 50
- 1480 Fay Rd Unit 105
- 1480 Fay Rd Unit 191
- 1480 Fay Rd Unit 143
- 1480 Fay Rd Unit 24
- 1480 Fay Rd Unit Lot 135