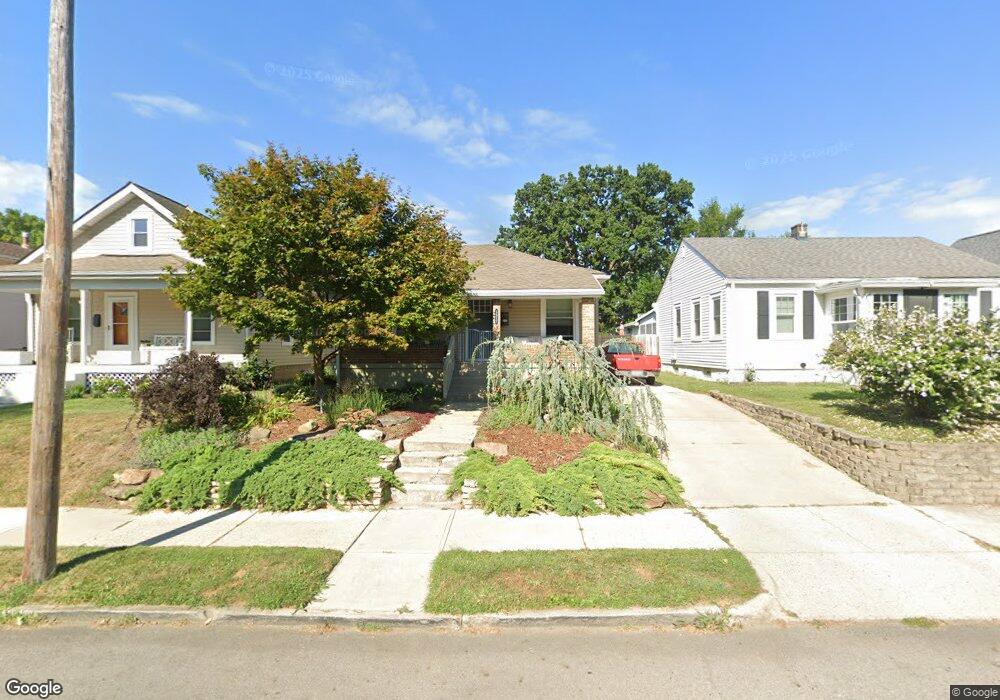
1517 Glenn Ave Columbus, OH 43212
Estimated Value: $338,718 - $544,000
2
Beds
1
Bath
985
Sq Ft
$404/Sq Ft
Est. Value
About This Home
This home is located at 1517 Glenn Ave, Columbus, OH 43212 and is currently estimated at $397,680, approximately $403 per square foot. 1517 Glenn Ave is a home located in Franklin County with nearby schools including Cranbrook Elementary School, Ridgeview Middle School, and Centennial High School.
Ownership History
Date
Name
Owned For
Owner Type
Purchase Details
Closed on
Nov 19, 2013
Sold by
1517 Glenn Llc
Bought by
Linkous Danielle N
Current Estimated Value
Home Financials for this Owner
Home Financials are based on the most recent Mortgage that was taken out on this home.
Original Mortgage
$203,395
Interest Rate
2.99%
Mortgage Type
Adjustable Rate Mortgage/ARM
Purchase Details
Closed on
Jun 26, 2013
Sold by
Crossley Properties Llc
Bought by
1517 Glenn Llc
Purchase Details
Closed on
Jun 18, 2013
Sold by
Hyatt Shirley B and Hyatt John K
Bought by
Crossley Properties Llc
Purchase Details
Closed on
Aug 4, 1992
Bought by
Hyatt John K and Hyatt Shirley B
Purchase Details
Closed on
Apr 21, 1992
Create a Home Valuation Report for This Property
The Home Valuation Report is an in-depth analysis detailing your home's value as well as a comparison with similar homes in the area
Home Values in the Area
Average Home Value in this Area
Purchase History
| Date | Buyer | Sale Price | Title Company |
|---|---|---|---|
| Linkous Danielle N | $214,100 | None Available | |
| 1517 Glenn Llc | -- | Amerititle Box | |
| Crossley Properties Llc | $102,100 | Bxamerititle | |
| Hyatt John K | $60,000 | -- | |
| -- | -- | -- |
Source: Public Records
Mortgage History
| Date | Status | Borrower | Loan Amount |
|---|---|---|---|
| Previous Owner | Linkous Danielle N | $203,395 |
Source: Public Records
Tax History Compared to Growth
Tax History
| Year | Tax Paid | Tax Assessment Tax Assessment Total Assessment is a certain percentage of the fair market value that is determined by local assessors to be the total taxable value of land and additions on the property. | Land | Improvement |
|---|---|---|---|---|
| 2024 | $4,744 | $105,710 | $61,080 | $44,630 |
| 2023 | $4,684 | $105,700 | $61,075 | $44,625 |
| 2022 | $4,023 | $77,570 | $27,970 | $49,600 |
| 2021 | $4,030 | $77,570 | $27,970 | $49,600 |
| 2020 | $4,036 | $77,570 | $27,970 | $49,600 |
| 2019 | $3,712 | $61,190 | $27,970 | $33,220 |
| 2018 | $3,495 | $61,190 | $27,970 | $33,220 |
| 2017 | $3,710 | $61,190 | $27,970 | $33,220 |
| 2016 | $3,620 | $54,640 | $26,460 | $28,180 |
| 2015 | $3,286 | $54,640 | $26,460 | $28,180 |
| 2014 | $3,388 | $54,640 | $26,460 | $28,180 |
| 2013 | $114 | $48,440 | $25,200 | $23,240 |
Source: Public Records
Map
Nearby Homes
- 1561 Glenn Ave
- 1459 Elmwood Ave Unit 1459
- 1655-1657 Ashland Ave
- 1661 Ashland Ave Unit 663
- 1733 Elmwood Ave
- 1313 Lincoln Rd
- 1782 Wyandotte Rd
- 2015 W 5th Ave Unit 211
- 2015 W 5th Ave Unit 102
- 2015 W 5th Ave Unit 108
- 1263 Oakland Ave
- 1631 Roxbury Rd Unit F3
- 1631 Roxbury Rd Unit B6
- 1475 W 3rd Ave Unit 204
- 1364 W 7th Ave
- 1825 Northwest Ct Unit D
- 00 W 7th Ave
- 1398 Lower Green Cir Unit 1398
- 1000 Urlin Ave Unit 1822
- 1000 Urlin Ave Unit 2007
- 1513 Glenn Ave
- 1523 Glenn Ave
- 1507 Glenn Ave Unit 509
- 1529 Glenn Ave
- 1501 Glenn Ave Unit 503
- 1535 Glenn Ave Unit 537
- 1516 Glenn Ave Unit 518
- 1539 Glenn Ave
- 1512 Glenn Ave
- 1520 Glenn Ave Unit 154
- 1520 Glenn Ave Unit 1524
- 1520-1524 Glenn Ave
- 1497 Glenn Ave
- 1504 Glenn Ave Unit 508
- 1528 Glenn Ave
- 1528 Wyandotte Rd
- 1520 Wyandotte Rd
- 1500 Glenn Ave
- 1500-1508 Glenn Ave
- 1536 Wyandotte Rd