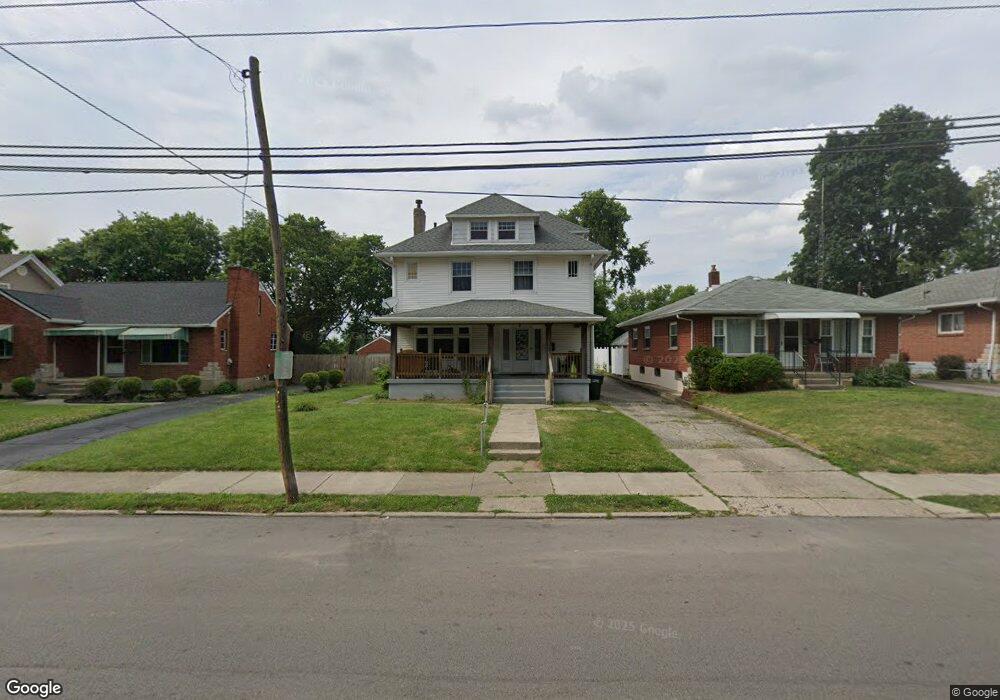
1517 Huffman Ave Dayton, OH 45403
Wright View NeighborhoodEstimated Value: $124,000 - $167,662
4
Beds
1
Bath
2,432
Sq Ft
$63/Sq Ft
Est. Value
About This Home
This home is located at 1517 Huffman Ave, Dayton, OH 45403 and is currently estimated at $153,916, approximately $63 per square foot. 1517 Huffman Ave is a home located in Montgomery County with nearby schools including Ruskin Elementary School, Kiser Elementary, and Horizon Science Academy Dayton Downtown.
Ownership History
Date
Name
Owned For
Owner Type
Purchase Details
Closed on
Apr 21, 2017
Sold by
Keybank Na
Bought by
Harrison Melissa C
Current Estimated Value
Home Financials for this Owner
Home Financials are based on the most recent Mortgage that was taken out on this home.
Original Mortgage
$58,913
Interest Rate
4.25%
Mortgage Type
FHA
Purchase Details
Closed on
Sep 29, 2016
Sold by
Kidrichard
Bought by
Keybank Na
Purchase Details
Closed on
Jun 18, 2004
Sold by
Household Realty Corp
Bought by
Wiseman Mary L and Riley Michelle L
Home Financials for this Owner
Home Financials are based on the most recent Mortgage that was taken out on this home.
Original Mortgage
$43,200
Interest Rate
6.37%
Mortgage Type
New Conventional
Purchase Details
Closed on
Feb 19, 2004
Sold by
Vernon Collins
Bought by
Household Realty Corp
Purchase Details
Closed on
Dec 30, 1994
Sold by
Thomas Donald A and Thomas Margaret E
Bought by
Collins Vernon
Create a Home Valuation Report for This Property
The Home Valuation Report is an in-depth analysis detailing your home's value as well as a comparison with similar homes in the area
Home Values in the Area
Average Home Value in this Area
Purchase History
| Date | Buyer | Sale Price | Title Company |
|---|---|---|---|
| Harrison Melissa C | $60,000 | None Available | |
| Keybank Na | $32,000 | None Available | |
| Wiseman Mary L | $54,000 | -- | |
| Household Realty Corp | $46,000 | -- | |
| Collins Vernon | -- | -- |
Source: Public Records
Mortgage History
| Date | Status | Borrower | Loan Amount |
|---|---|---|---|
| Previous Owner | Harrison Melissa C | $58,913 | |
| Previous Owner | Wiseman Mary L | $43,200 |
Source: Public Records
Tax History Compared to Growth
Tax History
| Year | Tax Paid | Tax Assessment Tax Assessment Total Assessment is a certain percentage of the fair market value that is determined by local assessors to be the total taxable value of land and additions on the property. | Land | Improvement |
|---|---|---|---|---|
| 2024 | $2,046 | $36,450 | $4,520 | $31,930 |
| 2023 | $2,046 | $36,450 | $4,520 | $31,930 |
| 2022 | $2,119 | $29,210 | $3,610 | $25,600 |
| 2021 | $2,108 | $29,210 | $3,610 | $25,600 |
| 2020 | $2,101 | $29,210 | $3,610 | $25,600 |
| 2019 | $1,999 | $24,960 | $4,740 | $20,220 |
| 2018 | $2,002 | $24,960 | $4,740 | $20,220 |
| 2017 | $1,311 | $24,960 | $4,740 | $20,220 |
| 2016 | $1,510 | $26,610 | $5,150 | $21,460 |
| 2015 | $1,429 | $26,610 | $5,150 | $21,460 |
| 2014 | $1,429 | $26,610 | $5,150 | $21,460 |
| 2012 | -- | $26,550 | $7,070 | $19,480 |
Source: Public Records
Map
Nearby Homes
- 515 Heiss Ave Unit 515-517
- 520 S Smithville Rd
- 1614 Huffman Ave Unit 1612
- 404 S Smithville Rd
- 1626 Darst Ave
- 1629 Suman Ave
- 715 Gondert Ave
- 1700 Suman Ave
- 1620 Gondert Ave Unit 1618
- 1620 Gondert Ave
- 1730 Darst Ave
- 631 Greenlawn Ave
- 1323 Huffman Ave
- 1714 Gondert Ave
- 1800 Darst Ave
- 763 Greenlawn Ave
- 420 Dawnview Ave
- 1815 Huffman Ave
- 223 Pleasant Ave
- 1345 Jordan Ave
- 1519 Huffman Ave
- 1507 Huffman Ave
- 1525 Huffman Ave
- 1505 Huffman Ave
- 1529 Huffman Ave
- 1501 Huffman Ave
- 1516 Darst Ave
- 1510 Darst Ave
- 1526 Darst Ave
- 1533 Huffman Ave
- 1500 Darst Ave
- 1487 Huffman Ave
- 1537 Huffman Ave
- 1530 Darst Ave
- 1482 Darst Ave
- 1536 Darst Ave
- 1541 Huffman Ave
- 1481 Huffman Ave
- 1477 Huffman Ave
- 1478 Darst Ave