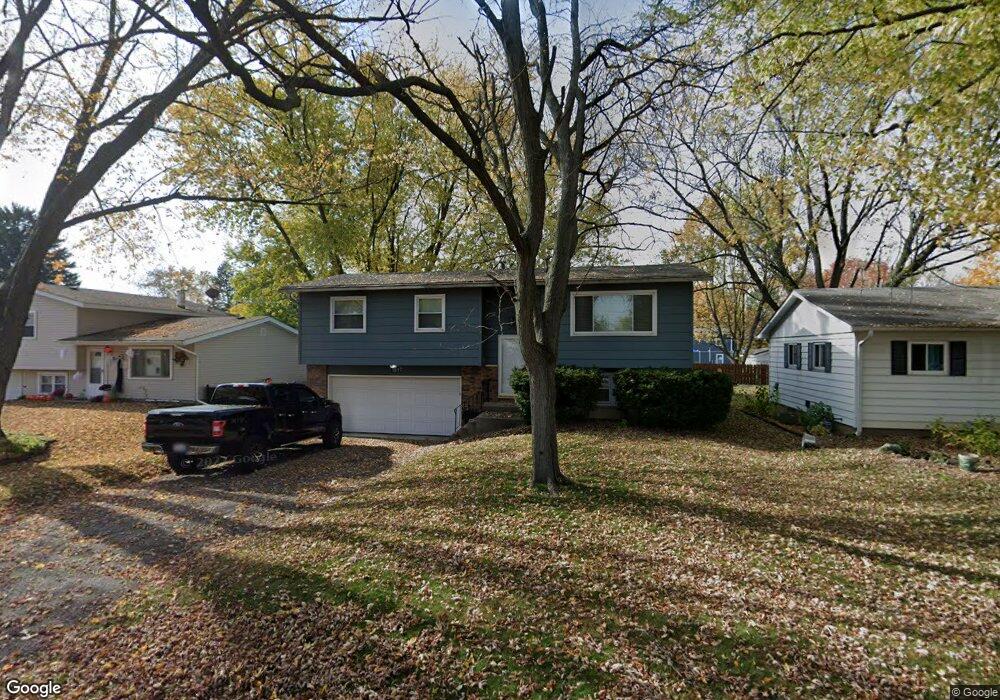
1517 Monroe St Lake In the Hills, IL 60156
Estimated Value: $267,884 - $327,000
3
Beds
2
Baths
1,132
Sq Ft
$268/Sq Ft
Est. Value
About This Home
This home is located at 1517 Monroe St, Lake In the Hills, IL 60156 and is currently estimated at $303,471, approximately $268 per square foot. 1517 Monroe St is a home located in McHenry County with nearby schools including Indian Prairie Elementary School, Lundahl Middle School, and Crystal Lake South High School.
Ownership History
Date
Name
Owned For
Owner Type
Purchase Details
Closed on
Aug 8, 2016
Sold by
Savelly Katherine M
Bought by
Saveley Steven E
Current Estimated Value
Purchase Details
Closed on
May 29, 1999
Sold by
Saveley Steven E and Chrostowski Katherine M
Bought by
Saveley Steven E and Saveley Katherine M
Home Financials for this Owner
Home Financials are based on the most recent Mortgage that was taken out on this home.
Original Mortgage
$124,745
Interest Rate
7.04%
Mortgage Type
FHA
Purchase Details
Closed on
May 5, 1999
Sold by
Cafcules Steven M and Cafcules Cheryl A
Bought by
Saveley Steven E and Chrostowski Katherine M
Home Financials for this Owner
Home Financials are based on the most recent Mortgage that was taken out on this home.
Original Mortgage
$124,745
Interest Rate
7.04%
Mortgage Type
FHA
Create a Home Valuation Report for This Property
The Home Valuation Report is an in-depth analysis detailing your home's value as well as a comparison with similar homes in the area
Home Values in the Area
Average Home Value in this Area
Purchase History
| Date | Buyer | Sale Price | Title Company |
|---|---|---|---|
| Saveley Steven E | -- | None Available | |
| Saveley Steven E | -- | -- | |
| Saveley Steven E | $132,000 | Universal Title Services Inc |
Source: Public Records
Mortgage History
| Date | Status | Borrower | Loan Amount |
|---|---|---|---|
| Open | Saveley Steven E | $111,060 | |
| Closed | Saveley Steven E | $130,850 | |
| Closed | Saveley Steven E | $125,800 | |
| Closed | Saveley Steven E | $124,745 |
Source: Public Records
Tax History Compared to Growth
Tax History
| Year | Tax Paid | Tax Assessment Tax Assessment Total Assessment is a certain percentage of the fair market value that is determined by local assessors to be the total taxable value of land and additions on the property. | Land | Improvement |
|---|---|---|---|---|
| 2024 | $6,617 | $84,473 | $9,324 | $75,149 |
| 2023 | $6,367 | $75,550 | $8,339 | $67,211 |
| 2022 | $5,599 | $63,611 | $7,526 | $56,085 |
| 2021 | $5,283 | $59,261 | $7,011 | $52,250 |
| 2020 | $5,162 | $57,163 | $6,763 | $50,400 |
| 2019 | $4,997 | $54,712 | $6,473 | $48,239 |
| 2018 | $4,941 | $52,877 | $13,248 | $39,629 |
| 2017 | $4,921 | $49,813 | $12,480 | $37,333 |
| 2016 | $4,800 | $46,720 | $11,705 | $35,015 |
| 2013 | -- | $45,969 | $10,919 | $35,050 |
Source: Public Records
Map
Nearby Homes
- 10 Lincoln St
- 528 Penny Ln
- 1549 Brompton Ln
- 1391 Acadia Cir
- 1279 Merrimack Ct
- 1549 Hollytree Ln Unit 2
- 1734 Somerfield Ln
- 1644 Stockton Ln
- 1289 Westport Ridge
- 275 Indian Trail
- 1114 Ash St
- 266 Dartmoor Dr
- 212 Village Creek Dr
- 1345 Cunat Ct Unit 1B
- 1345 Cunat Ct Unit 2D
- 116 Woody Way
- 7 Shoal Creek Ct
- 215 Indian Trail
- 1108 Heavens Gate
- 70 Hilltop Dr Unit 4
- 1515 Monroe St
- 1519 Monroe St
- 1513 Monroe St
- 1516 Washington St Unit 9
- 1518 Washington St Unit 9
- 1520 Washington St
- 1512 Washington St
- 1511 Monroe St
- 1516 Monroe St Unit 9
- 1518 Monroe St
- 1514 Monroe St
- 1522 Washington St
- 1512 Monroe St Unit 9
- 1520 Monroe St
- 1510 Washington St Unit 9
- 1509 Monroe St
- 19 Roosevelt Rd
- 1510 Monroe St
- 1522 Monroe St
- 1508 Washington St