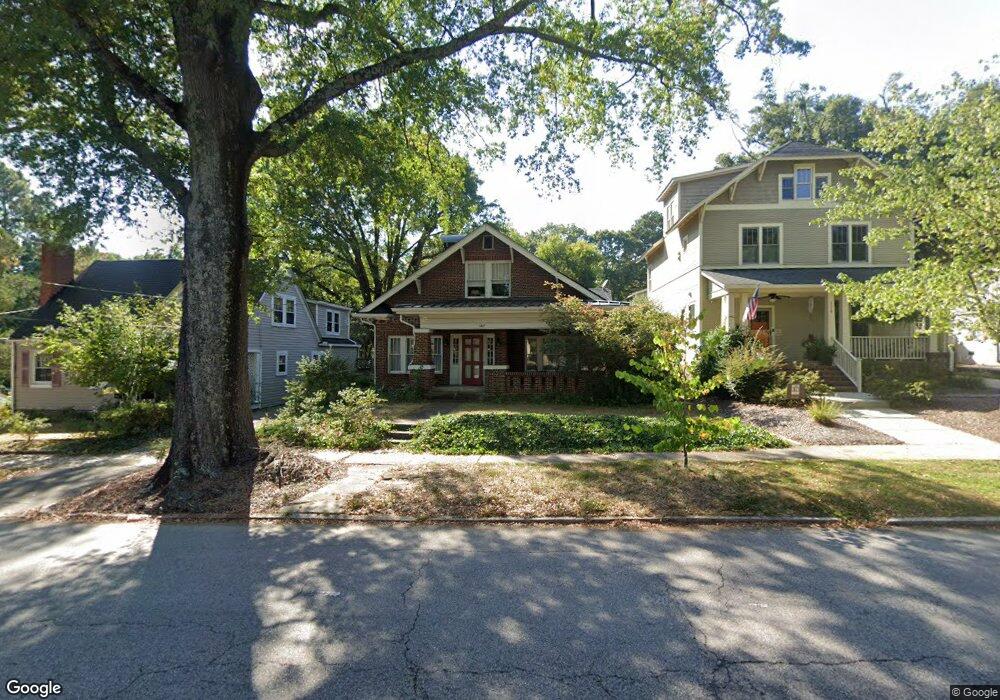
1517 N Duke St Durham, NC 27701
Trinity Park NeighborhoodEstimated Value: $741,000 - $847,000
5
Beds
2
Baths
2,543
Sq Ft
$313/Sq Ft
Est. Value
About This Home
This home is located at 1517 N Duke St, Durham, NC 27701 and is currently estimated at $796,640, approximately $313 per square foot. 1517 N Duke St is a home located in Durham County with nearby schools including George Watts Elementary, W.G. Pearson Elementary School, and Brogden Middle.
Ownership History
Date
Name
Owned For
Owner Type
Purchase Details
Closed on
May 13, 2008
Sold by
Rice Joyce G and Olk Cheryl L
Bought by
Weiner Norman G and Lieber Laura S
Current Estimated Value
Home Financials for this Owner
Home Financials are based on the most recent Mortgage that was taken out on this home.
Original Mortgage
$261,000
Outstanding Balance
$166,496
Interest Rate
6.02%
Mortgage Type
Purchase Money Mortgage
Estimated Equity
$630,144
Purchase Details
Closed on
Sep 15, 2005
Sold by
Holt Olimbe
Bought by
Rice Joyce G and Olk Cheryl L
Home Financials for this Owner
Home Financials are based on the most recent Mortgage that was taken out on this home.
Original Mortgage
$132,165
Interest Rate
5.72%
Mortgage Type
Construction
Purchase Details
Closed on
May 20, 2004
Sold by
Christakos Kalliope and Christakos Arthur C
Bought by
Holt Olimbe
Create a Home Valuation Report for This Property
The Home Valuation Report is an in-depth analysis detailing your home's value as well as a comparison with similar homes in the area
Home Values in the Area
Average Home Value in this Area
Purchase History
| Date | Buyer | Sale Price | Title Company |
|---|---|---|---|
| Weiner Norman G | $328,000 | None Available | |
| Rice Joyce G | $190,000 | -- | |
| Holt Olimbe | -- | -- |
Source: Public Records
Mortgage History
| Date | Status | Borrower | Loan Amount |
|---|---|---|---|
| Open | Weiner Norman G | $261,000 | |
| Previous Owner | Rice Joyce G | $132,165 |
Source: Public Records
Tax History Compared to Growth
Tax History
| Year | Tax Paid | Tax Assessment Tax Assessment Total Assessment is a certain percentage of the fair market value that is determined by local assessors to be the total taxable value of land and additions on the property. | Land | Improvement |
|---|---|---|---|---|
| 2025 | $6,171 | $622,475 | $270,000 | $352,475 |
| 2024 | $6,068 | $435,037 | $120,000 | $315,037 |
| 2023 | $5,699 | $435,037 | $120,000 | $315,037 |
| 2022 | $5,568 | $435,037 | $120,000 | $315,037 |
| 2021 | $5,542 | $435,037 | $120,000 | $315,037 |
| 2020 | $5,408 | $434,737 | $119,700 | $315,037 |
| 2019 | $5,408 | $434,737 | $119,700 | $315,037 |
| 2018 | $5,149 | $379,601 | $53,865 | $325,736 |
| 2017 | $5,111 | $379,601 | $53,865 | $325,736 |
| 2016 | $4,939 | $379,601 | $53,865 | $325,736 |
| 2015 | $3,393 | $245,134 | $45,815 | $199,319 |
| 2014 | $3,393 | $245,134 | $45,815 | $199,319 |
Source: Public Records
Map
Nearby Homes
- 711 W Club Blvd
- 1005 W Club Blvd
- 1407 N Duke St
- 1417 Ruffin St
- 630 W Club Blvd
- 1609 Dexter St
- 1405 Watts St
- 1300 Ruffin St
- 903 Green St
- 1109 N Duke St
- 1017 N Buchanan Blvd Unit A
- 506 Everett Place
- 805 Green St
- 1009 N Gregson St
- 707 Ruby St
- 621 Ruby St
- 1502 Washington St
- 804 Ruby St
- 909 N Gregson St
- 1306 W Knox St
- 1515 N Duke St
- 1519 N Duke St
- 1521 N Duke St
- 1412 Norton St
- 1511 N Duke St
- 1414 Norton St
- 903 W Club Blvd
- 1509 N Duke St
- 1410 Norton St
- 905 W Club Blvd
- 1518 N Duke St
- 1524 N Duke St
- 1516 N Duke St
- 1514 N Duke St
- 1416 Norton St
- 1520 N Duke St
- 909 W Club Blvd
- 1507 N Duke St
- 1512 N Duke St
- 1532 N Duke St