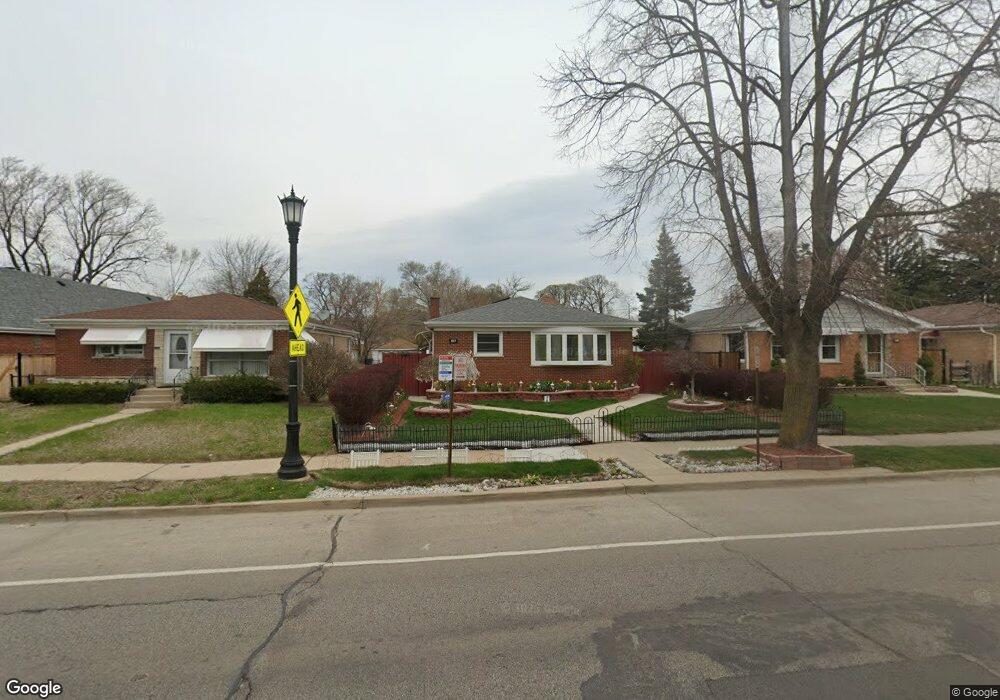
1517 Oakton St Evanston, IL 60202
Estimated Value: $416,000 - $659,000
3
Beds
1
Bath
1,120
Sq Ft
$441/Sq Ft
Est. Value
About This Home
This home is located at 1517 Oakton St, Evanston, IL 60202 and is currently estimated at $493,847, approximately $440 per square foot. 1517 Oakton St is a home located in Cook County with nearby schools including Dawes Elementary School, Chute Middle School, and Evanston Township High School.
Ownership History
Date
Name
Owned For
Owner Type
Purchase Details
Closed on
Jan 23, 2008
Sold by
Edwards Willie L
Bought by
Edwards Antonette C
Current Estimated Value
Purchase Details
Closed on
Aug 27, 2004
Sold by
Hohlman Joanne C
Bought by
Edwards Willie and Edwards Antonette
Home Financials for this Owner
Home Financials are based on the most recent Mortgage that was taken out on this home.
Original Mortgage
$248,850
Interest Rate
6.35%
Mortgage Type
Unknown
Purchase Details
Closed on
Jul 19, 2001
Sold by
Angelo Michelle L and Hohlman Joanne C
Bought by
Hohlman Joanne Carole
Purchase Details
Closed on
Feb 26, 1996
Sold by
Muench Helen
Bought by
Angelo Michelle I and Hohlman Joanne C
Home Financials for this Owner
Home Financials are based on the most recent Mortgage that was taken out on this home.
Original Mortgage
$118,800
Interest Rate
7.16%
Create a Home Valuation Report for This Property
The Home Valuation Report is an in-depth analysis detailing your home's value as well as a comparison with similar homes in the area
Home Values in the Area
Average Home Value in this Area
Purchase History
| Date | Buyer | Sale Price | Title Company |
|---|---|---|---|
| Edwards Antonette C | -- | None Available | |
| Edwards Willie | $276,500 | -- | |
| Hohlman Joanne Carole | -- | -- | |
| Angelo Michelle I | $132,000 | -- |
Source: Public Records
Mortgage History
| Date | Status | Borrower | Loan Amount |
|---|---|---|---|
| Previous Owner | Edwards Willie | $248,850 | |
| Previous Owner | Angelo Michelle I | $118,800 |
Source: Public Records
Tax History Compared to Growth
Tax History
| Year | Tax Paid | Tax Assessment Tax Assessment Total Assessment is a certain percentage of the fair market value that is determined by local assessors to be the total taxable value of land and additions on the property. | Land | Improvement |
|---|---|---|---|---|
| 2024 | $7,642 | $34,472 | $11,187 | $23,285 |
| 2023 | $7,744 | $36,331 | $11,187 | $25,144 |
| 2022 | $7,744 | $36,331 | $11,187 | $25,144 |
| 2021 | $6,413 | $27,176 | $8,136 | $19,040 |
| 2020 | $6,386 | $27,176 | $8,136 | $19,040 |
| 2019 | $6,820 | $32,160 | $8,136 | $24,024 |
| 2018 | $6,975 | $28,559 | $6,780 | $21,779 |
| 2017 | $6,808 | $28,559 | $6,780 | $21,779 |
| 2016 | $6,680 | $28,559 | $6,780 | $21,779 |
| 2015 | $4,770 | $20,164 | $5,593 | $14,571 |
| 2014 | $4,739 | $20,164 | $5,593 | $14,571 |
| 2013 | $5,548 | $23,714 | $5,593 | $18,121 |
Source: Public Records
Map
Nearby Homes
- 532 Wesley Ave Unit WEST
- 419 Florence Ave
- 1408 Seward St
- 401 Dewey Ave
- 347 Florence Ave
- 1810 South Blvd
- 704 Florence Ave
- 604 Dodge Ave
- 1916 Keeney St
- 1217 Hull Terrace Unit 3A
- 647 Asbury Ave
- 309 Darrow Ave
- 1927 Warren St
- 553 Barton Ave
- 1214 Hull Terrace
- 325 Dodge Ave
- SAN JUAN GRANDE La Cascabela
- 1810 Washington St
- 1021 South Blvd
- 1406 Brummel St
- 1521 Oakton St
- 1515 Oakton St
- 1523 Oakton St
- 1507 Oakton St
- 1529 Oakton St
- 1516 South Blvd
- 1518 South Blvd
- 505 Florence Ave
- 1512 South Blvd
- 1503 Oakton St
- 1522 South Blvd
- 1510 South Blvd
- 1510 South Blvd
- 1524 South Blvd
- 1508 South Blvd
- 1528 South Blvd
- 1433 Oakton St
- 1530 South Blvd
- 1502 South Blvd
- 1431 Oakton St Unit W