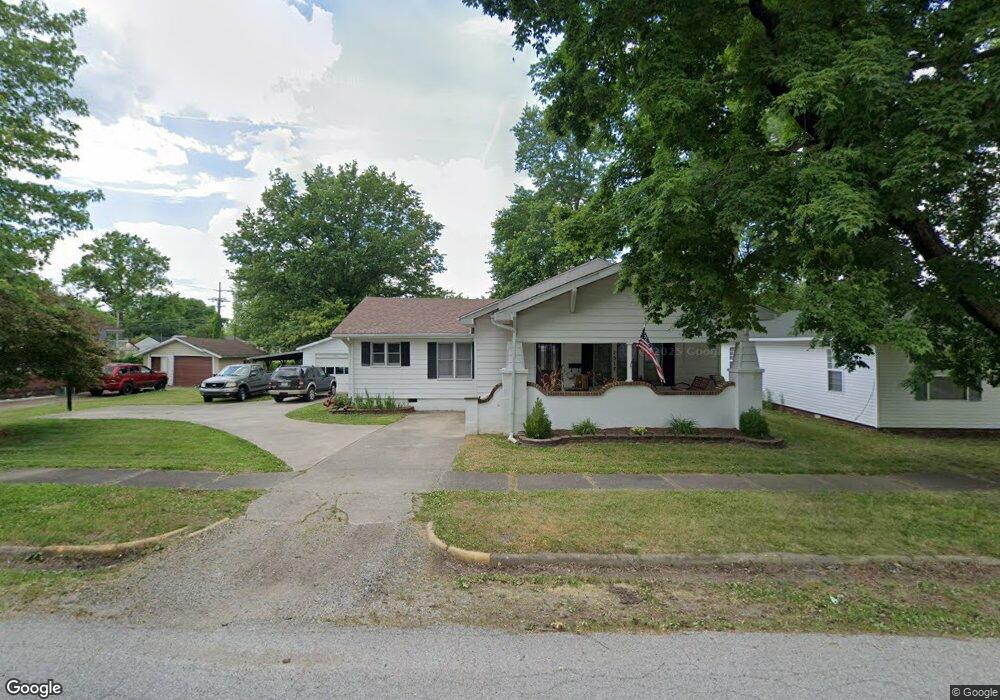
1517 S 3rd St Clinton, IN 47842
Estimated Value: $119,000 - $148,539
4
Beds
1
Bath
1,553
Sq Ft
$87/Sq Ft
Est. Value
About This Home
This home is located at 1517 S 3rd St, Clinton, IN 47842 and is currently estimated at $135,885, approximately $87 per square foot. 1517 S 3rd St is a home located in Vermillion County with nearby schools including South Vermillion High School and Sacred Heart School.
Ownership History
Date
Name
Owned For
Owner Type
Purchase Details
Closed on
Mar 12, 2020
Sold by
Bose Brian J and Bose Amber R
Bought by
Eslinger Dennis J and Eslinger Savanna M
Current Estimated Value
Home Financials for this Owner
Home Financials are based on the most recent Mortgage that was taken out on this home.
Original Mortgage
$60,000
Outstanding Balance
$53,037
Interest Rate
3.4%
Mortgage Type
New Conventional
Estimated Equity
$82,848
Purchase Details
Closed on
Dec 19, 2008
Sold by
Estate Of Mason Ernest Webber Dec Wi We
Bought by
Rose Brian J and Rose Amber R
Create a Home Valuation Report for This Property
The Home Valuation Report is an in-depth analysis detailing your home's value as well as a comparison with similar homes in the area
Home Values in the Area
Average Home Value in this Area
Purchase History
| Date | Buyer | Sale Price | Title Company |
|---|---|---|---|
| Eslinger Dennis J | -- | Integrity Title Services | |
| Rose Brian J | $65,000 | Beardsley Law Office | |
| Bose Brian J | $65,000 | -- |
Source: Public Records
Mortgage History
| Date | Status | Borrower | Loan Amount |
|---|---|---|---|
| Open | Eslinger Dennis J | $60,000 |
Source: Public Records
Tax History Compared to Growth
Tax History
| Year | Tax Paid | Tax Assessment Tax Assessment Total Assessment is a certain percentage of the fair market value that is determined by local assessors to be the total taxable value of land and additions on the property. | Land | Improvement |
|---|---|---|---|---|
| 2024 | $1,117 | $111,700 | $17,900 | $93,800 |
| 2023 | $1,011 | $101,100 | $17,900 | $83,200 |
| 2022 | $1,001 | $100,900 | $17,900 | $83,000 |
| 2021 | $884 | $89,200 | $17,900 | $71,300 |
| 2020 | $823 | $80,900 | $22,100 | $58,800 |
| 2019 | $635 | $62,100 | $12,600 | $49,500 |
| 2018 | $635 | $62,100 | $12,600 | $49,500 |
| 2017 | $630 | $61,600 | $12,600 | $49,000 |
| 2016 | $611 | $59,900 | $12,600 | $47,300 |
| 2014 | $568 | $58,600 | $12,600 | $46,000 |
| 2013 | $568 | $58,600 | $12,600 | $46,000 |
Source: Public Records
Map
Nearby Homes
- 1409 S 4th St
- 0 S Main St
- 1400 S 8th St
- 947 S Main St
- 1025 S 6th St
- 734 S 6th St
- 525 S 4th St
- 660 Mulberry St
- 559 Mulberry St
- 1059 Blackman St
- 1146 Blackman St
- 2359 E St Rd 163
- 359 N 3rd St
- 522 N Main St
- 626 N Main St
- 15034 S Willow Grove Ave
- 821 N 8th St
- 945 Morey St
- 1102 Matthews St
- 1095 Oakridge Dr