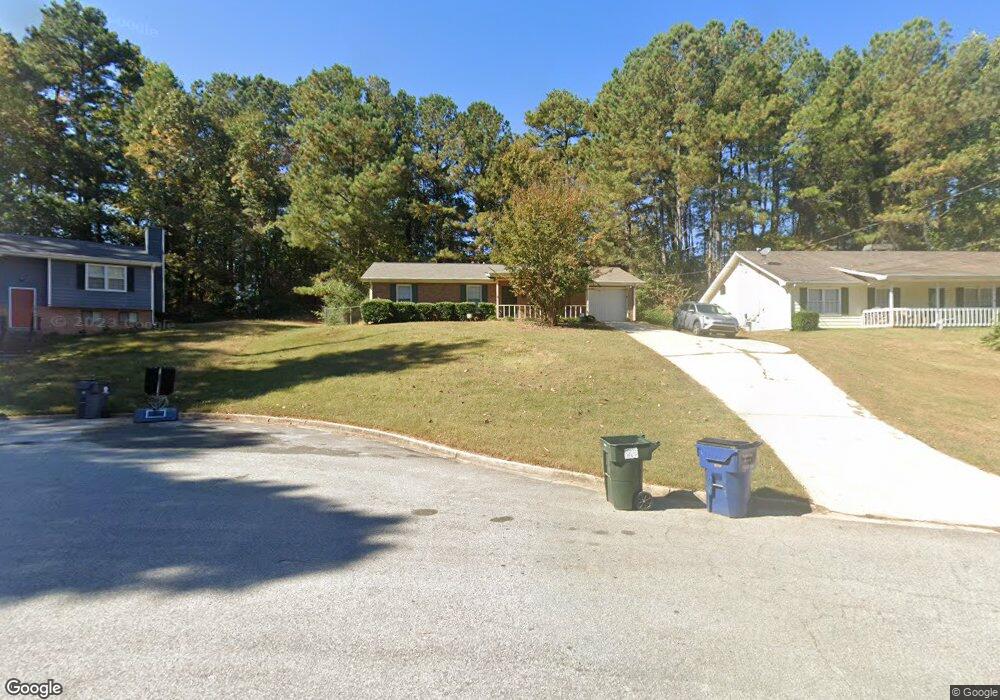
1517 Sugarplum Place SW Conyers, AZ 30094
Estimated Value: $201,000 - $227,000
3
Beds
2
Baths
1,290
Sq Ft
$169/Sq Ft
Est. Value
About This Home
This home is located at 1517 Sugarplum Place SW, Conyers, AZ 30094 and is currently estimated at $218,199, approximately $169 per square foot. 1517 Sugarplum Place SW is a home located in Rockdale County with nearby schools including Sims Elementary School, Edwards Middle School, and Heritage High School.
Ownership History
Date
Name
Owned For
Owner Type
Purchase Details
Closed on
Jun 23, 2022
Sold by
Sfr Investments V Borrower 1 Llc
Bought by
Progress Residential Borrower 20 Llc
Current Estimated Value
Home Financials for this Owner
Home Financials are based on the most recent Mortgage that was taken out on this home.
Original Mortgage
$632,332,032
Outstanding Balance
$239,828,937
Interest Rate
5.1%
Mortgage Type
Mortgage Modification
Estimated Equity
-$239,610,738
Purchase Details
Closed on
Jun 23, 2021
Sold by
Atl 2 Sf Llc
Bought by
Sfr Investments V Borrower 1 Llc
Purchase Details
Closed on
Aug 19, 2015
Sold by
Seals Darlene
Bought by
Atl 2 Sf Llc
Purchase Details
Closed on
Dec 28, 1998
Sold by
Kirk Patricia D and Kirk Sheri L
Bought by
Seals Darlene
Home Financials for this Owner
Home Financials are based on the most recent Mortgage that was taken out on this home.
Original Mortgage
$81,175
Interest Rate
6.77%
Mortgage Type
FHA
Create a Home Valuation Report for This Property
The Home Valuation Report is an in-depth analysis detailing your home's value as well as a comparison with similar homes in the area
Home Values in the Area
Average Home Value in this Area
Purchase History
| Date | Buyer | Sale Price | Title Company |
|---|---|---|---|
| Progress Residential Borrower 20 Llc | -- | -- | |
| Sfr Investments V Borrower 1 Llc | $2,364,327 | -- | |
| Atl 2 Sf Llc | $76,500 | -- | |
| Seals Darlene | $81,900 | -- |
Source: Public Records
Mortgage History
| Date | Status | Borrower | Loan Amount |
|---|---|---|---|
| Open | Progress Residential Borrower 20 Llc | $632,332,032 | |
| Previous Owner | Seals Darlene | $81,175 |
Source: Public Records
Tax History Compared to Growth
Tax History
| Year | Tax Paid | Tax Assessment Tax Assessment Total Assessment is a certain percentage of the fair market value that is determined by local assessors to be the total taxable value of land and additions on the property. | Land | Improvement |
|---|---|---|---|---|
| 2024 | $3,199 | $79,279 | $14,612 | $64,667 |
| 2023 | $3,310 | $80,080 | $14,760 | $65,320 |
| 2022 | $2,540 | $60,680 | $11,120 | $49,560 |
| 2021 | $1,699 | $40,080 | $8,920 | $31,160 |
| 2020 | $1,551 | $36,000 | $7,480 | $28,520 |
| 2019 | $1,601 | $35,280 | $6,760 | $28,520 |
| 2018 | $1,325 | $29,000 | $4,560 | $24,440 |
| 2017 | $1,379 | $29,920 | $4,560 | $25,360 |
| 2016 | $1,379 | $29,920 | $4,560 | $25,360 |
| 2015 | $228 | $22,240 | $3,120 | $19,120 |
| 2014 | $210 | $22,240 | $3,120 | $19,120 |
| 2013 | -- | $25,640 | $6,000 | $19,640 |
Source: Public Records
Map
Nearby Homes
- 1461 Cherry Hill Rd SW
- 1806 Mccollum Rd SW
- 1624 Sugarmaple Ln SW
- 1593 Cherry Hill Ln SW
- 1598 Cherry Hill Ln SW Unit 5
- 2305 Lochinver Ln SW
- 2203 Liberty Ln SW Unit 2
- 2315 Lochinver Ln SW
- 1675 Mccollum Rd SW
- 170 Old Mill Trail SW
- 2325 Lochinver Ln SW
- 2370 Ebenezer Rd SE
- 2329 Lochinver Ln SW
- 325 Yukon Dr Unit 66
- 335 Yukon Dr Unit 61
- 341 Yukon Dr Unit 58
- 4980 SE West Lake Dr
- 4811 SE West Lake Dr
- 2704 Forest Park Ct Unit 1
- 2067 Ebenezer Rd SW
- 1517 Sugarplum Place SW Unit 272
- 1517 Sugarplum Place SW
- 1517 Sugarplum Place SW
- 1519 Sugarplum Place SW
- 1515 Sugarplum Place SW
- 1574 Cherry Hill Rd SW
- 1570 Cherry Hill Rd SW
- 1578 Cherry Hill Rd SW
- 1513 Sugarplum Place SW
- 1566 Cherry Hill Rd SW
- 1520 Sugarplum Place SW Unit 5
- 1582 Cherry Hill Rd SW
- 1516 Sugarplum Place SW Unit 5
- 1514 Sugarplum Place SW
- 1511 Sugarplum Place SW
- 1511 Sugarplum Place SW Unit N/
- 1518 Sugarplum Place SW
- 1562 Cherry Hill Rd SW Unit 228
- 1562 Cherry Hill Rd SW
- 1562 Cherry Hill Rd SW Unit 1562