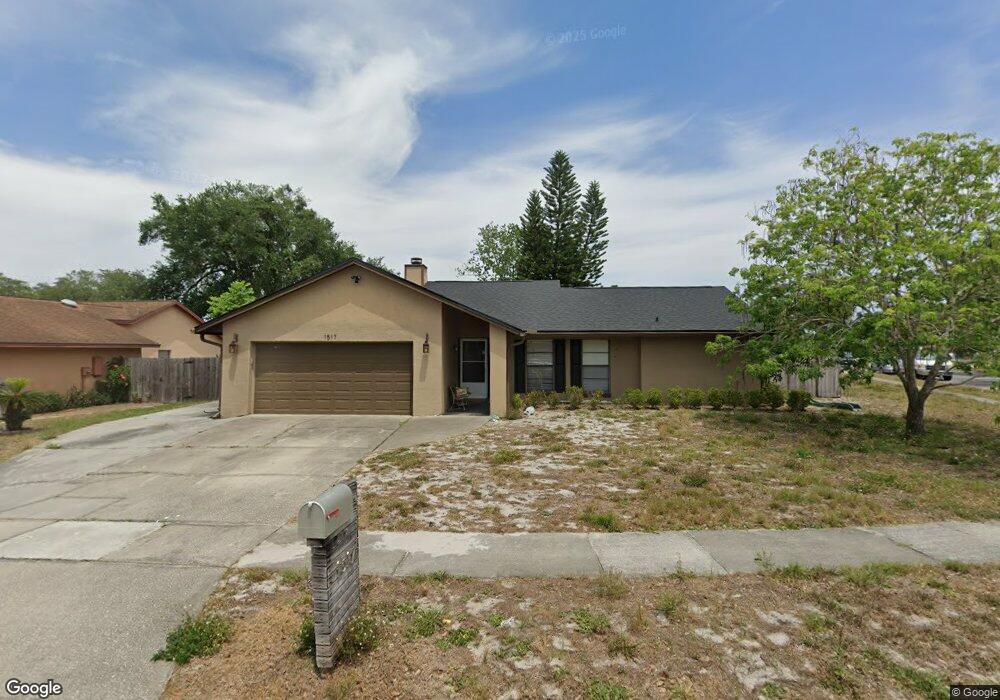
1517 W Crossbeam Cir Casselberry, FL 32707
Estimated Value: $384,000 - $435,000
3
Beds
2
Baths
1,588
Sq Ft
$256/Sq Ft
Est. Value
About This Home
This home is located at 1517 W Crossbeam Cir, Casselberry, FL 32707 and is currently estimated at $406,438, approximately $255 per square foot. 1517 W Crossbeam Cir is a home located in Seminole County with nearby schools including Sterling Park Elementary School, South Seminole Academy, and Lake Howell High School.
Ownership History
Date
Name
Owned For
Owner Type
Purchase Details
Closed on
May 20, 2013
Sold by
Cuellar Ann E
Bought by
Cuellar Christopher
Current Estimated Value
Purchase Details
Closed on
Mar 20, 2012
Sold by
Wright Mary Jane and Wright Mary Mclaughlin
Bought by
Cuellar Ann
Purchase Details
Closed on
Mar 1, 2012
Bought by
Cuellar Christopher
Purchase Details
Closed on
Jan 1, 2012
Bought by
Cuellar Christopher
Purchase Details
Closed on
Mar 3, 1999
Sold by
Hoyt George E and Hoyt Linda A
Bought by
Lofstrand Warren A and Lofstrand Elizabeth T
Purchase Details
Closed on
May 1, 1990
Bought by
Cuellar Christopher
Purchase Details
Closed on
Oct 1, 1987
Bought by
Cuellar Christopher
Purchase Details
Closed on
Oct 1, 1983
Bought by
Cuellar Christopher
Purchase Details
Closed on
Jul 1, 1983
Bought by
Cuellar Christopher
Create a Home Valuation Report for This Property
The Home Valuation Report is an in-depth analysis detailing your home's value as well as a comparison with similar homes in the area
Home Values in the Area
Average Home Value in this Area
Purchase History
| Date | Buyer | Sale Price | Title Company |
|---|---|---|---|
| Cuellar Christopher | -- | None Available | |
| Cuellar Ann | -- | Attorney | |
| Cuellar Christopher | $100 | -- | |
| Cuellar Christopher | $100 | -- | |
| Lofstrand Warren A | $129,000 | -- | |
| Cuellar Christopher | $108,700 | -- | |
| Cuellar Christopher | $110,000 | -- | |
| Cuellar Christopher | $85,000 | -- | |
| Cuellar Christopher | $1,472,500 | -- |
Source: Public Records
Tax History Compared to Growth
Tax History
| Year | Tax Paid | Tax Assessment Tax Assessment Total Assessment is a certain percentage of the fair market value that is determined by local assessors to be the total taxable value of land and additions on the property. | Land | Improvement |
|---|---|---|---|---|
| 2024 | $1,900 | $157,485 | -- | -- |
| 2023 | $1,852 | $152,898 | $0 | $0 |
| 2021 | $1,727 | $144,121 | $0 | $0 |
| 2020 | $1,708 | $142,131 | $0 | $0 |
| 2019 | $1,688 | $138,935 | $0 | $0 |
| 2018 | $1,663 | $136,344 | $0 | $0 |
| 2017 | $1,648 | $133,540 | $0 | $0 |
| 2016 | $1,679 | $131,709 | $0 | $0 |
| 2015 | $1,422 | $129,884 | $0 | $0 |
| 2014 | $1,422 | $128,853 | $0 | $0 |
Source: Public Records
Map
Nearby Homes
- 1278 Snug Harbor Dr
- 1916 Mitchellbrook Ln
- 368 Fairgreen Place
- 1505 Southwind Ct
- 1762 Laurel Brook Loop Unit 1
- 891 N Jerico Dr
- 1243 Bridlebrook Dr
- 1510 Barking Deer Cove
- 1819 Laurel Brook Loop
- 1779 Laurel Brook Loop Unit 1
- 1736 Setting Sun Loop
- 429 Copperstone Cir
- 1576 Crossbeam Dr
- 225 Twelve League Cir
- 1485 Waukon Cir
- 4001 Misty Morning Place
- 205 S Wilderness Point
- 250 Raintree Dr Unit 24
- 1457 Waukon Cir
- 3965 Journey Ct
- 1515 W Crossbeam Cir
- 1525 W Crossbeam Cir
- 1505 W Crossbeam Cir
- 1522 W Crossbeam Cir
- 1516 W Crossbeam Cir
- 1518 W Crossbeam Cir
- 1524 W Crossbeam Cir
- 1503 W Crossbeam Cir
- 1520 W Crossbeam Cir
- 1514 W Crossbeam Cir
- 1527 W Crossbeam Cir
- 1526 W Crossbeam Cir
- 1512 W Crossbeam Cir
- 1508 W Crossbeam Cir
- 1506 W Crossbeam Cir
- 413 Fairgreen Ave
- 1501 W Crossbeam Cir
- 1510 W Crossbeam Cir
- 1504 W Crossbeam Cir
- 1319 Snug Harbor Dr