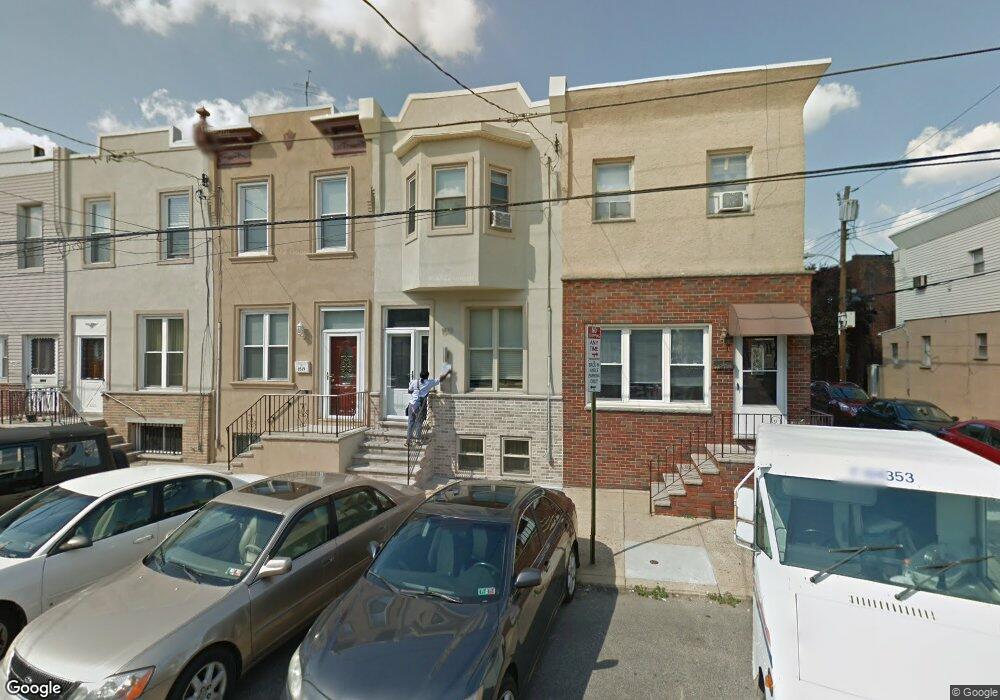
1517 W Shunk St Philadelphia, PA 19145
South Philadelphia West NeighborhoodEstimated Value: $281,496 - $336,000
3
Beds
2
Baths
1,284
Sq Ft
$248/Sq Ft
Est. Value
About This Home
This home is located at 1517 W Shunk St, Philadelphia, PA 19145 and is currently estimated at $318,374, approximately $247 per square foot. 1517 W Shunk St is a home located in Philadelphia County with nearby schools including F. Amedee Bregy School, South Philadelphia High School, and Philadelphia Performing Arts Charter School.
Ownership History
Date
Name
Owned For
Owner Type
Purchase Details
Closed on
Oct 27, 2020
Sold by
Mcfarland Joseph G
Bought by
Mcfarland Joseph G and Mcfarland Joanna M
Current Estimated Value
Home Financials for this Owner
Home Financials are based on the most recent Mortgage that was taken out on this home.
Original Mortgage
$200,000
Outstanding Balance
$144,462
Interest Rate
2.8%
Mortgage Type
New Conventional
Estimated Equity
$173,912
Purchase Details
Closed on
Dec 14, 2012
Sold by
Mcfarland Joseph G and Killian Kristina
Bought by
Mcfarland Joseph G
Purchase Details
Closed on
Sep 17, 2008
Sold by
Bohannon Jane Ivie and Bohannon Susannah Faye
Bought by
Mcfarland Joseph G and Killian Kristina
Home Financials for this Owner
Home Financials are based on the most recent Mortgage that was taken out on this home.
Original Mortgage
$181,693
Interest Rate
6.54%
Mortgage Type
FHA
Purchase Details
Closed on
Jul 12, 2002
Sold by
Winters Kathleen
Bought by
Dneaster Michael and Dneaster Dawn
Create a Home Valuation Report for This Property
The Home Valuation Report is an in-depth analysis detailing your home's value as well as a comparison with similar homes in the area
Home Values in the Area
Average Home Value in this Area
Purchase History
| Date | Buyer | Sale Price | Title Company |
|---|---|---|---|
| Mcfarland Joseph G | -- | City Abstract Llc | |
| Mcfarland Joseph G | -- | None Available | |
| Mcfarland Joseph G | $185,000 | None Available | |
| Dneaster Michael | $87,000 | -- |
Source: Public Records
Mortgage History
| Date | Status | Borrower | Loan Amount |
|---|---|---|---|
| Open | Mcfarland Joseph G | $200,000 | |
| Previous Owner | Mcfarland Joseph G | $181,693 |
Source: Public Records
Tax History Compared to Growth
Tax History
| Year | Tax Paid | Tax Assessment Tax Assessment Total Assessment is a certain percentage of the fair market value that is determined by local assessors to be the total taxable value of land and additions on the property. | Land | Improvement |
|---|---|---|---|---|
| 2025 | $3,287 | $253,900 | $50,780 | $203,120 |
| 2024 | $3,287 | $253,900 | $50,780 | $203,120 |
| 2023 | $3,287 | $234,800 | $46,960 | $187,840 |
| 2022 | $2,111 | $189,800 | $46,960 | $142,840 |
| 2021 | $2,741 | $0 | $0 | $0 |
| 2020 | $2,741 | $0 | $0 | $0 |
| 2019 | $2,548 | $0 | $0 | $0 |
| 2018 | $2,006 | $0 | $0 | $0 |
| 2017 | $2,426 | $0 | $0 | $0 |
| 2016 | $2,006 | $0 | $0 | $0 |
| 2015 | $1,920 | $0 | $0 | $0 |
| 2014 | -- | $173,300 | $16,290 | $157,010 |
| 2012 | -- | $15,488 | $2,891 | $12,597 |
Source: Public Records
Map
Nearby Homes
- 2521 S Hicks St
- 1506 W Porter St
- 1528 W Porter St
- 2428 S Broad St
- 2634 S 16th St
- 2621 S Rosewood St
- 2423 S Bancroft St
- 1500 W Ritner St
- 1614 W Ritner St
- 1439 W Ritner St
- 1603 W Ritner St
- 2642 S 17th St
- 2338 S 16th St
- 2620 S Colorado St
- 2331 S 16th St
- 2342 44 S Broad St
- 1524 W Moyamensing Ave
- 2326 S Carlisle St
- 2540 S Clarion St
- 2514 S Clarion St
- 1519 W Shunk St
- 1521 W Shunk St
- 1515 W Shunk St
- 1515 W Shunk St Unit 2F
- 1523 W Shunk St
- 1525 W Shunk St
- 2542 S Hicks St
- 2540 S Hicks St
- 2543 S Mole St
- 1527 W Shunk St
- 2541 S Mole St
- 2538 S Hicks St
- 1513 W Shunk St
- 2539 S Mole St
- 2536 S Hicks St
- 1511 W Shunk St
- 2537 S Mole St
- 2543 S Hicks St
- 2541 S Hicks St
- 2534 S Hicks St